10-K: Annual report [Section 13 and 15(d), not S-K Item 405]
Published on February 26, 2026
UNITED STATES
SECURITIES AND EXCHANGE COMMISSION
Washington, D.C. 20549
FORM 10-K
For the fiscal year ended December 31 , 2025
or
Commission file number: 001-42619
(Exact name of registrant as specified in its charter)
(302 ) 294-4651
| State or other jurisdiction of incorporation or organization | (I.R.S. Employer Identification No.) | |||||||||||||
(Address of Principal Executive Offices) | (Zip Code) | |||||||||||||||||||
(Registrant’s Telephone Number, Including Area Code)
Securities registered pursuant to Section 12(b) of the Act:
| Title of each class | Trading Symbol(s) | Name of each exchange on which registered | ||||||
No securities are registered pursuant to Section 12(g) of the Act.
_____________________________________________________
Indicate by check mark if the registrant is a well-known seasoned issuer, as defined in Rule 405 of the Securities Act. ☐ Yes þ No
Indicate by check mark if the registrant is not required to file reports pursuant to Section 13 or Section 15(d) of the Act. ☐ Yes þ No
Indicate by check mark whether the registrant (1) has filed all reports required to be filed by Section 13 or 15(d) of the Securities Exchange Act of 1934 during the preceding 12 months (or for such shorter period that the registrant was required to file such reports), and (2) has been subject to such filing requirements for the past 90 days.
þ Yes ☐ No
Indicate by check mark whether the registrant has submitted electronically every Interactive Data File required to be submitted pursuant to Rule 405 of Regulation S-T (§232.405 of this chapter) during the preceding 12 months (or for such shorter period that the registrant was required to submit such files).
☑ Yes ☐ No
Indicate by check mark whether the registrant is a large accelerated filer, an accelerated filer, a non-accelerated filer, a smaller reporting company, or an emerging growth company. See the definitions of “large accelerated filer,” “accelerated filer,” “smaller reporting company,” and "emerging growth company" in Rule 12b-2 of the Exchange Act.
| Large Accelerated Filer | ☐ | Accelerated filer | ☐ | ||||||||||||||||||||
| ☑ | Smaller reporting company | ||||||||||||||||||||||
| Emerging growth company | |||||||||||||||||||||||
If an emerging growth company, indicate by check mark if the registrant has elected not to use the extended transition period for complying with any new or revised financial accounting standards provided pursuant to Section 13(a) of the Exchange Act. ☐
Indicate by check mark whether the registrant has filed a report on and attestation to its management’s assessment of the effectiveness of its internal control over financial reporting under Section 404(b) of the Sarbanes-Oxley Act (15 U.S.C. 7262(b)) by the registered public accounting firm that prepared or issued its audit report. ☐
If securities are registered pursuant to Section 12(b) of the Act, indicate by check mark whether the financial statements of the registrant included in the filing reflect the correction of an error to previously issued financial statements. ☐
1
Indicate by check mark whether any of those error corrections are restatements that required a recovery analysis of incentive-based compensation received by any of the registrant’s executive officers during the relevant recovery period pursuant to §240.10D-1(b). ☐
Indicate by check mark whether the registrant is a shell company (as defined in Rule 12b-2 of the Act). ☐ Yes ☑ No
As of June 30, 2025, the last business day of the registrant's most recently completed second fiscal quarter, the registrant's common stock was not publicly traded. As of November 3, 2025, the date on which the registrant's common stock began “regular-way” trading on the New York Stock Exchange, the aggregate market value of the registrant’s voting common stock held by non-affiliates of the registrant was approximately $20 billion.
The registrant had 209,658,907 shares of common stock, $0.01 par value, outstanding at February 24, 2026.
DOCUMENTS INCORPORATED BY REFERENCE
Part III: Proxy Statement for the 2026 Annual Meeting of Stockholders to be filed not later than 120 days after the end of the fiscal year covered by this Form 10-K.
2
Qnity Electronics, Inc.
ANNUAL REPORT ON FORM 10-K
For the year ended December 31, 2025
TABLE OF CONTENTS
| Page | |||||||||||
3
| Qnity Electronics, Inc. | ||
CAUTIONARY NOTE REGARDING FORWARD-LOOKING STATEMENTS
This Annual Report on Form 10-K (this “Annual Report”) contains "forward-looking statements" within the meaning of the federal securities laws, including Section 27A of the Securities Act of 1933, as amended, and Section 21E of the Securities Exchange Act of 1934, as amended, regarding future events and the future results of Qnity Electronics, Inc. (“Qnity” or the “Company”) and its subsidiaries (collectively, “we,” “us,” and “our”). In this context, forward-looking statements often address expected future business and financial performance and financial condition, and often contain words such as “expect”, “anticipate”, “intend”, “plan”, “believe”, “seek”, “see”, “will”, “would”, “target”, “outlook”, “stabilization”, “confident”, “preliminary”, “initial”, “continue”, “may”, “could”, “project”, “estimate”, “forecast” and similar expressions and variations or negatives of these words, among others, as well as other words or expressions referencing future events, conditions or circumstances. All statements, other than statements of historical fact, are forward-looking statements, including statements that describe or relate to Qnity’s plans, goals, intentions, strategies, financial estimates, Qnity’s expectations regarding the Separation (as defined herein), and statements that do not relate to historical or current fact. Forward-looking statements are based on our current beliefs, expectations and assumptions, which may not prove to be accurate, and involve a number of known and unknown risks and uncertainties, many of which are out of Qnity’s control, that could cause actual results to differ materially from those expressed in any forward-looking statements.
Forward-looking statements are not guarantees of future performance. Some of the important factors that could cause Qnity’s actual outcomes and results to differ materially from those projected in any such forward-looking statements include, but are not limited to: the competitive environment in which we operate; the risks from our international operations, including trade restrictions and sanctions laws; our ability to comply with complex and increasing legal and regulatory requirements; interruptions in the operations of our manufacturing facilities; volatility in cost of inputs, including energy and raw materials; our ability to attract and retain talented people; reliance on key customers and suppliers; failure to protect our intellectual property or allegations that we have infringed the intellectual property of others; cybersecurity and privacy considerations; legal proceedings and investigatory risks; the ability to realize the intended benefits of the Separation and the Distribution (as defined herein), including achievement of the anticipated synergies and operational efficiencies in connection with the Separation and completed and future, if any, divestitures, mergers, acquisitions, and other portfolio management, productivity and infrastructure actions; contractual allocation from DuPont de Nemours, Inc. (“DuPont”) of certain liabilities; the possibility of disputes, litigation or unanticipated costs in connection with the Separation and the Distribution and other risk factors set forth under “Risk Factors” and "Management’s Discussion and Analysis of Financial Condition and Results of Operations” and elsewhere in this Annual Report, as well as in our press releases and other filings with the Securities and Exchange Commission ("SEC"). Qnity may not actually achieve the plans, intentions or expectations disclosed in its forward-looking statements. New risk factors emerge from time to time and it is not possible to predict all such risk factors, nor can Qnity assess the impact of all such risk factors on its business or the extent to which any factor or combination of factors may cause actual results to differ materially from those contained in any forward-looking statements.
For the reasons described above, Qnity cautions you against relying on any forward-looking statements, which should also be read in conjunction with this Annual Report and the documents referenced within this Annual Report and the other cautionary statements that are included elsewhere in this Annual Report and in Qnity’s public filings, including under “Management’s Discussion and Analysis of Financial Condition and Results of Operations.” Forward-looking statements reflect Qnity’s beliefs and opinions on the relevant subject. These statements are based upon information available to Qnity as of the date of this Annual Report, and while Qnity believes such information forms a reasonable basis for such statements, such information may be limited or incomplete, and statements should not be read to indicate that Qnity has conducted an exhaustive inquiry into, or review of, all potentially available relevant information. All forward-looking statements attributable to Qnity or persons acting on its behalf are expressly qualified in their entirety by the foregoing cautionary statements. Qnity does not undertake any obligation to publicly update or revise any forward-looking statements, whether as a result of new information, future developments or otherwise, should circumstances change, except as otherwise required by securities and other applicable laws.
Trademarks
All trademarks, service marks or registered trademarks referred to in this Annual Report are trademarks, service marks or registered trademarks of affiliates of the Company. Solely for convenience, the trademarks in this Annual Report are referred to without TM, SM or ® symbols, but such references should not be construed as any indicator that the Company or, to the extent applicable, their respective owners, will not assert, to the fullest extent under applicable law, the Company’s or their rights thereto. We do not intend the use or display of other companies’ trademarks to imply a relationship with, or endorsement or sponsorship of us by, any other companies.
4
Website and Social Media Disclosure
The Company may use its website and/or social media outlets, such as Facebook, LinkedIn, X and WeChat, as distribution channels of material company information. Financial and other important information regarding the Company is routinely posted on and accessible through the Company’s website at https://ir.qnityelectronics.com, its LinkedIn page at https://linkedin.com/company/qnityelectronics and its WeChat account at https://mp.weixin.qq.com/s/JV7BeMMNyLIpCmoI5oczRA. In addition, you may automatically receive email alerts and other information about the Company when you enroll your email address by visiting the “Email Alerts” section under the “Resources” section at https://ir.qnityelectronics.com.
The contents of the Company’s website, including those referenced above and elsewhere in this report, are not intended to be incorporated by reference into this Annual Report on Form 10-K or in any other report or document Qnity has or in the future may file, or furnish to, with the SEC, and any references to the Company’s websites are intended to be inactive textual references only.
5
| Qnity Electronics, Inc. | ||||||||
| PART I | ||||||||
ITEM 1. BUSINESS
Our Company
Qnity is one of the largest global leaders in materials and solutions for the semiconductor and electronics industries. We empower our customers’ technology roadmaps to enable advancements in megatrends such as artificial intelligence, high-performance computing and advanced connectivity. We partner with leading semiconductor and advanced device manufacturers to address complex challenges and develop solutions that facilitate next-generation technological innovations. With over 50 years of experience in systems engineering and material science, a global manufacturing footprint and major application labs across the world, we are well-positioned to capitalize on emerging opportunities across various sectors including data centers, communications infrastructure, industrials, automotive, and consumer electronics.
On May 22, 2024, DuPont de Nemours, Inc. ("DuPont" or "Parent") announced its plan to separate Qnity from DuPont into an independent publicly traded company (the “Separation”). On November 1, 2025 (the "Separation and Distribution Date"), DuPont completed the Separation through a pro-rata distribution of one share of Qnity common stock for every two shares of DuPont common stock held at the close of business on the record date of October 22, 2025 (the "Distribution"). As a result of the Distribution, as of the Separation and Distribution Date, Qnity became an independent, publicly traded company, and Qnity common stock commenced trading on the New York Stock Exchange under the symbol "Q" at the start of trading on November 3, 2025.
We have aligned our businesses, and report our financial results, across two operating segments:
•Semiconductor Technologies: Our Semiconductor Technologies segment provides a portfolio of innovative materials and solutions utilized across multiple stages of the semiconductor manufacturing process. These advanced materials are qualified into customers’ roadmaps, designed to improve chip performance, enhance yield and enable leading-edge node technology.
•Interconnect Solutions: Our Interconnect Solutions segment offers what we believe to be a comprehensive range of best-in-class material solutions that address the evolving complexities of signal integrity, thermal and power management and advanced packaging. These solutions are integral for advanced electronics hardware, including complex printed circuit boards and advanced semiconductor packaging.
Our broad portfolio of solutions and materials across both Semiconductor Technologies and Interconnect Solutions segments positions us as a comprehensive solutions provider for our customers. We collaborate with key players throughout the electronics value chain, including many of the leading semiconductor device manufacturers, foundries and equipment providers. Additionally, we partner with original equipment manufacturers ("OEMs") who specify our products into their manufacturing process. Qnity is often the partner of choice due to our strong innovation capabilities and extensive materials and engineering expertise. In a fast-paced electronics industry, our customers’ needs are highly performance-driven and our long-standing relationships and strong renewal rates demonstrate our commitment to delivering excellence in a demanding market.
Our products are consumable or unit-driven, with over 90% of Qnity’s revenue in 2025 generated from products that are either utilized in the manufacturing process or incorporated into final electronic devices.
6
Semiconductor Technologies Segment
Semiconductor Technologies lines of business and applications are as follows:
| Line of Business | Applications | ||||
| Advanced Cleans and CMP Slurries | We are a leading provider of CMP slurries and specialty cleaning chemistries for liquid and dry film photoresist removal, post-CMP cleaning, selective etching and post-etch residue cleaning. Our advanced formulations enable effective CMP polishing, wafer cleaning, surface preparation, cleaning and selective etching. Our specialized formulations help customers achieve higher productivity and improved yields on designs with finer line width and spacing. Key brands include PlasmaSolv®, CuSolve™, PCMPSolv™, EtchSolv™ Acuplane™, Optiplane™ and Novaplane™. | ||||
| CMP Pads | CMP polishing pads are critical consumables used in the CMP process as part of semiconductor manufacturing. Product families are designed to address the most challenging planarization requirements across various applications and technology nodes. We have strong partnerships with major customers to accelerate product and process development, including CMP processes below 7 nm and planarization materials for 3D-IC technologies. CMP pads have served as the industry standard for many years, and we have a leading position in advanced technology nodes. We also offer advanced features which can be used across product families to further meet the individual needs of customers, including groove designs and windows. Key brands include IC1000™, Ikonic™, Visionpad™, Optivision™, Politex™, Suba™ and Emblem™ | ||||
| Lithographic Materials | Lithographic materials, such as photoresists and anti-reflective coating materials, help create precise patterns for modern semiconductor devices. These materials provide high resolution and reliability, supporting innovations in computing, artificial intelligence and next-generation automotive technology. We offer materials for all lithography wavelengths, including ultraviolet, deep ultraviolet and EUV lithography. We have a long history in lithography technology with many industry-first innovations and a breadth of offerings. Key brands include EPIC™, EON™, AR™, MICROPOSIT™, MEGAPOSIT™, UVN™, CTO™ and SPR™. | ||||
| Kalrez® Specialized Sealants | Kalrez® perfluoroelastomer parts are engineered for critical sealing applications in industries such as semiconductor manufacturing, aerospace, chemical processing and energy. These elastomers are designed to perform under the most demanding conditions, making them ideal for use in environments where high heat and chemical exposure are prevalent. One notable product, Kalrez® 9100, has been a top sealant for integrated circuit manufacturing processes for nearly 20 years, showcasing its reliability and effectiveness. Kalrez® offers custom perfluoroelastomer parts tailored to unique geometries, providing the superior sealing capabilities necessary for high-performance operations. | ||||
| Advanced Display Materials | Qnity is a leading supplier of innovative materials and processes for organic light-emitting diode ("OLED") displays. For the last decade, we have pioneered advanced OLED materials, launching the first mass-produced red phosphorescent OLED host. Our OLED materials offer higher efficiency, reduced voltage requirements, enhanced refractive index and improved longevity for next-gen displays. | ||||
The market for semiconductors has grown significantly over the last several decades, with several trends particularly benefiting our business:
•Emerging Technologies: The proliferation of artificial intelligence ("AI"), high performance and cloud computing, 5G, next generation automotive vehicles and the IoT, which we believe will continue to drive demand for semiconductors and our position therein. Further, advancements in semiconductor technology lead to increased layering in chips, which in turn requires a greater volume of manufacturing materials, more complex material formulations and, consequently, higher price points.
7
•Chip Design Innovation: These emerging technologies demand more powerful, faster, and more energy-efficient semiconductors. Semiconductor manufacturers are required to innovate rapidly to meet these demands, and the ability to adapt semiconductor architectures is often enabled by solutions provided by materials companies, including Qnity. As the industry moves toward smaller nodes and heterogeneous integration, material innovation plays a key role in enabling next-generation chips. Advanced materials are critical for technology inflections such as advanced nodes, 3D NAND, chiplet designs, advanced Dynamic Random Access Memory ("DRAM") and High Bandwidth Memory ("HBM") and advanced packaging. Partnerships with foundries and integrated device manufacturers are crucial for aligning material development with future technology roadmaps.
•Geopolitical Dynamics: Supply chain disruptions and geopolitical concerns over the last several years highlight the critical need for resilient global supply networks. In response, governments worldwide are co-investing in semiconductor industries to ensure domestic supply, creating new opportunities for semiconductor companies including Qnity.
The production of semiconductors involves numerous intricate and precise manufacturing processes, which are often repeated as layers deposited on silicon wafers. For Qnity, our focus lies in delivering high-purity materials (pads and slurries for chemical mechanical planarization, photoresists, cleaning chemistries, etchants) that meet the increasingly stringent demands of performance, energy efficiency and reliability. Qnity benefits and is expected to continue to benefit from the “processing material multiplier” effect associated with semiconductor manufacturing, as advanced nodes for logic and memory require three to five times more processing material per wafer compared to legacy nodes. The semiconductor manufacturing processes where our solutions are most utilized are as follows:
•Chemical Mechanical Planarization ("CMP"). CMP is a critical step that is used multiple times in the semiconductor manufacturing process at each layer of the wafer to remove excess materials and create a smooth surface. This is done through the interaction of a pad and slurry on a polishing tool. Fabricators choose specific materials for each CMP process based on performance needs of each CMP application and node. Our product offerings in CMP include:
◦CMP Pads: CMP pads, or polishing pads, are consumables that are placed onto a platen on a CMP polishing tool to flatten and smooth the surface of wafers through a combination of chemical and mechanical actions.
◦CMP Slurries: Slurries are made up of a combination of key additives which enable precise polishing of the wafer surface. Slurries are designed to enable planarization and material removal such that surface quality and material property integrity is maintained or improved.
•Photolithography. Photolithography, or microlithography, is an imaging technology that is critical to etch steps in semiconductor manufacturing. It is used to transfer circuitry patterns from a photomask to a silicon wafer, after which etch processes complete the pattern. Several of our products are utilized throughout the photolithography process, including:
◦Photoresists: Photoresists are light-sensitive materials that are used to transfer circuit patterns onto substrates. Photoresists are designed based on the wavelength of light they respond to, including g-line (436 nm), i-line (365 nm), KrF (248 nm), dry and immersion ArF (193 nm) and extreme ultraviolet (13.5 nm) lithography.
◦Functional sub-layers: Below-resist solutions such as anti-reflective coating materials and underlayers boost the effectiveness of lithography by widening and improving the process and reflectivity windows.
◦Advanced overcoats: Topcoats (above-resist solutions) for positive and negative tone development, immersion lithography and spin-on solutions enable resist line trim for enhanced resolution, fewer defects and improved line width roughness.
•Cleaning. Specialty removal and cleaning chemistries are used after semiconductor fabrication process steps including etch and CMP, to remove residues and provide a smooth surface for subsequent steps. Our products used in the cleaning process include:
◦Post-CMP Cleaners: Aqueous formulations employed for cleaning after CMP processes, designed to protect the planarized metals and dielectrics preventing metal corrosion while providing a smooth defect-free wafer surface.
◦Post-Etch Residue Removers: Aqueous and semi-aqueous organic mixtures formulated to effectively remove residues from substrate surfaces through poly and metal etch processes.
◦Emerging Cleans: High selectivity etching solutions for advanced node technologies and enabling cleaning chemistries to prevent pattern collapse and reduce defects in extreme ultraviolet ("EUV") lithography.
8
Interconnect Solutions Segment
Interconnect Solutions lines of business and applications are as follows:
| Line of Business | Applications | ||||
| Advanced Circuit & Packaging (“ACP”) | ACP offers comprehensive solutions for advanced packaging, IC substrates, PCBs, components and displays. We specialize in metallization solutions that include electroless and electrolytic plating chemistries, and final finishing; semiconductor packaging that includes metallization, photoresist and dielectrics as well as optical materials, conductive adhesive, and silver nanowire technologies. These innovations address the challenges of miniaturization, signal integrity, thermal and power management for high-performance computing and high-frequency connectivity. They are specifically designed to meet the complex performance demands while keeping our commitment to quality and reliability. Key brands include Circuposit™, Ecoposit™, Microfab™, Microfill™, Nikal™, Riston®, Skyton™, Silveron™, Solderon™ and Intervia™. | ||||
| Laird Technologies (Thermal, electromagnetic interference (“EMI”), Power Management) | Laird Technologies is a global leader in high-performance thermal and electromagnetic shielding solutions with a broad portfolio catering to diverse markets. Our advanced components and materials deliver innovative solutions that manage heat and protect devices from EMI, addressing the demands of modern electronic applications such as high-performance computing, AI, 5G telecommunications, smart vehicles and internet of things ("IoT") devices. Laird is a leader in attractive TIMs and EMI materials, particularly gap filler pads, liquid gap fillers, phase change materials, EMI absorbers and shields, and multifunctional materials. Key brands include Tputty™, Tflex™, CoolZorb™. | ||||
| Advanced Flex Technologies (“AFT”) | AFT develops and supplies based flexible solutions for advanced electronics used in consumer devices, AI, data center, automotive, aerospace, and industrial applications. Our polyimide films and flexible copper-clad laminate materials as well as acrylic and epoxy based laminate systems are engineered to meet the electrical, thermal, mechanical, and chemical requirements of demanding flexible electronic and insulation applications. AFT’s position reflects its long-standing performance record, broad materials capabilities, and mission critical applications across demanding end markets where consistent performance and reliability in challenging environments are essential. Key brands include Kapton®, Oasis®, Pyralux®, and Interra®. | ||||
The Interconnect Solutions segment plays a vital role in the semiconductor value chain by enabling the seamless interconnection of various electronic components. This segment encompasses several sub-sectors including advanced packaging, thermal and power management solutions and Printed Circuit Board ("PCB") materials, which are foundational to modern electronic devices:
•Advanced Packaging. Advanced packaging technologies, including wafer-level packaging ("WLP"), chip-scale packaging ("CSP") and system-in-package ("SiP"), rely on cutting-edge and specialty materials to enable scalability to the next generation of computing. Critical materials such as fine line circuit metallization chemistry, dielectrics and photoresists are essential in enabling increasingly high-density, high-speed and high-power advanced semiconductors. These innovations are essential for applications such as AI, data center, 5G infrastructure, high-performance computing and automotive electronics. Our offerings include:
◦Copper Pillar Plating: Copper pillars are used to vertically create electrical connections between chips with interposers and substrates. It plays a critical role in the electrical, mechanical and thermal performance of the packaging. Advanced copper pillar bumps enable higher input/output densities, allowing for miniaturization of devices that are essential for advanced semiconductor applications.
◦Copper Redistribution Layers ("RDLs"): RDLs are used to route signals from the chip’s bond pads to a larger footprint, allowing for increased routing flexibility. They are essential for integrating chips into smaller packages and achieving high-density interconnects.
◦Solder Bump Plating: Standard solder bumps are used to connect chips and Integrated Circuit ("IC") substrate in flip-chip technology, enabling reliable electrical connections. We are also specialized in micro-solder bumps (µ-bumps), which are widely used in HBM to enable the electrical connections between each memory dies.
◦Under Bump Metallization ("UBM"): UBM refers to the metallization layer applied beneath solder bumps to improve adhesion and reliability of solder joints. It is crucial for ensuring robust electrical interconnections and minimizing thermal and mechanical stress.
9
◦Photoresists: These light-sensitive materials are used in photolithography to pattern features on semiconductor wafers. As a foundational component of the photolithography process, photoresist material determines the minimum feature size, resolution, and yield of semiconductor devices, with its performance being especially crucial for advanced, high-density chips and ultra fine interconnects.
◦Packaging Dielectrics: These electrically insulating materials are used in packaging to separate conductive lines and layers and maintain signal integrity. They play a crucial role in minimizing dielectric loss to ensure structural integrity, electrical performance and reliable, high-density connections.
•Thermal Management. Effective thermal management is increasingly critical in advanced electronics such as AI and high-performance computing, which operate at higher power densities and generate more heat. Thermal Interface Materials ("TIMs"), heat spreaders, and supporting specialty adhesives play a central role in ensuring device performance and reliability. Our portfolio addresses these needs through the following solutions:
◦Gap Fillers: Available as die cut parts or dispensable liquid materials, gap fillers eliminate air pockets between heat generating components and heat sinks. They combine high thermal conductivity with mechanical compliance, delivering long-term reliability in use and improving system-level thermal performance.
◦Phase Change: For AI and high-performance computing ("HPC") processors, phase change TIMs enable faster processing speeds and improved reliability. These materials leverage latent heat absorption and one-time-only phase transition, allowing them to flow into microscopic surface irregularities and establish highly efficient thermal contact.
◦Specialty TIMs: Engineered for applications where traditional materials fall short, our specialty TIMs deliver enhanced thermal transfer, high adhesion, and superior reliability under demanding conditions. These materials are particularly valuable for high power AI data centers and automotive electronics.
◦Thermally Conductive Insulators: These materials provide both heat dissipation and electrical insulation, preventing short circuits in densely packed assemblies. They are essential for designs that require safe, reliable thermal performance without compromising electrical isolation.
•PCB materials. The PCB sector, which serves as the backbone of electronic interconnections, is undergoing transformation driven by the rise of AI, HPC and advanced electronics, which demands high density interconnect (HDI), high layer count multi-layer board ("HLC MLB") and flexible PCB designs. Such designs require essential products like high-performance substrates, advanced circuit metallization chemistries, dielectrics and photoresists that enable the fabrication of these next-generation PCBs. With applications spanning AI, data center, high end consumer electronics, automotive, aerospace, and industrial systems, this sector remains a cornerstone of the Interconnect Solutions segment. Some of our PCB-related offerings include:
◦Plating Solutions: Plating solutions are used to deposit copper and other metals onto PCB surfaces and drilled holes & vias, creating conductive pathways that facilitate electrical connections. This process is essential for generating high-density interconnects and improving the electrical performance and reliability of PCBs. The ability to achieve fine features and complex geometries makes plating chemistries vital for advanced PCB manufacturing.
◦Dry Film Photoresists: Dry film photoresists are polymer films applied to the surface of PCBs to define patterns for etching or plating. They provide high-resolution imaging capabilities, allowing manufacturers to create intricate features needed for modern electronic circuits. The ease of application, superior precision, consistent thickness and durability of dry film photoresists make them a favored choice for precision circuit fabrication.
◦Laminates: Copper clad laminates are composite materials used as the base substrate for PCBs and provide excellent electrical insulation, thermal stability and mechanical strength. High-performance laminates are essential for supporting complex circuit designs and ensuring the reliability of electronic devices in various applications.
◦Polyimide Films: Polyimide films are known for their excellent electrical insulating properties and thermal stability. They are often used in flexible PCBs, which require materials that can withstand high temperatures while maintaining performance and superior flexibility. Polyimide films are critical in applications requiring flexibility and reliability, such as in robotics, aerospace, automotive and portable and wearable electronics.
10
Our Strengths and Strategy
With over 50 years of experience, we are a recognized leader in the electronics materials market. We believe that the following strengths set us apart from our competitors and drive our continued success:
•Breadth and Depth of Product Portfolio of Critical Solutions for Innovation-Driven, High-Growth Markets. As a global leader in electronics materials, we provide a diverse range of products throughout the electronic value chain. We believe our expertise and knowledge throughout the electronics value chain makes us a differentiated partner of choice.
•Deep Customer Intimacy with Industry Leaders. We work closely with our customers – directly engaging with semiconductor manufacturers, advanced device manufacturers and OEMs – to develop advanced technologies and address their most challenging needs. Our long-standing reputation of strong collaboration and deep customer knowledge enables us to work together on technology roadmaps and innovate solutions that enhance our customers’ competitive edge.
•Innovation Leadership Driven by Superior Materials Science and Engineering Expertise. We leverage our strong materials science and engineering expertise to drive innovative solutions and industry advancements. We believe that our innovations have significantly enhanced the productivity and scalability of semiconductor and device manufacturers, enabling electronics to become faster, smaller and more reliable.
•Regionalized Sourcing and Production Operations in Key Geographies. We source the vast majority of raw materials locally, with approximately 70% of raw materials sourced local-for-local. This further supports our diversified supply chain while limiting exposure to tariff risk. Approximately 80% of all products are manufactured and sold within the same geographic region.
•Diversified and Highly Integrated Supply Chain. We collaborate directly with suppliers to improve their performance, capacity and supply continuity, as the reliability and availability of products are essential for customers. In addition, we have a very well-diversified set of suppliers, with no supplier representing more than 10% of our raw material spend, avoiding significant dependency on any one or few suppliers.
•Well-Invested, Global Manufacturing Footprint with Customer-Centric Operations. Our global manufacturing footprint and efficient logistics ensure superior support, joint development and reliable supply for our customers. With approximately 40 manufacturing sites and facilities across all of our geographic regions, we can provide localized services in every major country in the industry. We have strategically located our major research facilities and manufacturing plants in close proximity to industry-leading customers across Taiwan, South Korea, China, Europe and the U.S. This enables ongoing strength in our continued development partnership and manufacturing coordination with our customers.
•Operational Excellence with Long Standing Industry Experience. Our customers require effective and reliable products and processes. With over 50 years of operational experience and extensive in-house industry expertise, we deliver trusted solutions that meet those needs.
•Attractive Financial Profile. We believe that our advanced portfolio is well positioned to drive above-market growth through increased content per wafer, share gains, higher customer spend and expanded addressable markets. Additionally, the strength of our operational footprint has facilitated attractive cash generation, as we have efficiently managed our investments in facilities.
•Excellence in Environmental, Health and Safety Performance. Our commitment to safety and operational excellence is a cornerstone of our ability to operate responsibly within communities worldwide. Our Environmental, Health & Safety Management System is ISO 14001 and Responsible Care Management System certified at the corporate level.
11
Qnity aims to be the most innovative and customer-centric leader in the electronics industry, concentrating on the critical materials sectors essential for powering the technology of tomorrow. Our strategy centers on several key factors:
•Maintain and strengthen position in high growth, innovation-driven markets: We recognize that our products and solutions play a crucial role in the manufacturing of technologies related to artificial intelligence and data centers, high-performance computing, 5G networks, IoT, Advanced Driver Assistance Systems ("ADAS") and electric vehicles ("EVs"). Our offerings are expertly designed to meet the challenges posed by future technologies, addressing critical factors such as processing speed and performance, signal integrity, thermal and power management and miniaturization.
•Innovate further in next-generation technologies: Developing tomorrow’s technologies demands a strong focus on innovation and performance. As a trusted partner with industry-leading clients, we have a deep understanding of their product needs and technology roadmaps. Our global footprint facilitates local collaboration and co-development, enabling us to effectively address their challenges related to performance, reliability and yield.
•Leverage operational excellence expertise: Our scale enables us to maintain a competitive cost structure, supported by ongoing productivity and efficiency improvements across our global manufacturing network. We continue to invest in our supply chain and manufacturing capabilities to attain world-class process technologies that prioritize quality, automation, rapid design, prototyping and streamlined supply chain management.
•Build on commercial excellence strengths: As a customer-centric organization, we recognize that our success is dependent upon our customers’ success. As a trusted partner, we empower our customers to execute their strategic roadmaps. Our sales force effectiveness, disciplined product management, optimized route to market and key account management capabilities are critical elements of our commercial platform that helps drive growth across both our existing customer base while continuing to scale into market adjacencies and new customer opportunities.
•Drive systematic capital management and resource allocation: Our focus is on driving profitable growth and enhancing return on capital. Leveraging our extensive global footprint, we can focus on targeted, modular and agile investments in our existing network rather than committing to new large-scale asset developments.
•Recruit and develop talent: We have a long-tenured talent base, which boasts extensive work experience, technical qualifications and industry expertise. Our commitment to recruiting, retaining and developing our global workforce is crucial to our success in a competitive environment.
•Respond to customers’ demand for sustainable products: Our customers increasingly prioritize sustainable products, and we anticipate a growing demand for these eco-friendly solutions. We recognize the need to innovate and develop environmentally responsible offerings for our customers’ needs and strengthen our competitive position in the market.
•Grow through opportunistic acquisitions: We may also pursue bolt-on and strategic acquisitions that represent an attractive return profile, building on our track record of successfully acquiring and integrating acquisitions with solutions that enhance and expand our portfolio.
Our Customers
We are a trusted partner within the electronics manufacturing ecosystem, with collaborative relationships with OEMs and industry partners who specify our materials for their final product. We work as a design partner with OEMs, often working directly through their fabricator network. Our diverse customer base includes semiconductor device manufacturers and foundries, equipment providers, circuit board manufacturers and other intermediaries within the electronics value chain. Our global operations enable us to maintain local knowledge and a presence that is close to our customers.
Notably, the average length of our relationship with our top 10 customers exceeds 30 years, solidifying our position as a partner of choice throughout the electronics value chain. We are proud to count nearly all of the world’s top 20 largest semiconductor manufacturers among our customers. While we have contracts with certain top customers, these contracts do not contain long-term purchase commitments. Instead, we work closely with our customers to develop non-binding forecasts for the purchase and sale of our products over the short-term and pursuant to certain payment terms and conditions based on the type and location of the customer and the products or services purchased. Our customers may cancel their orders, change production quantities from forecasted volumes or delay production for reasons beyond our control. Our business is not substantially dependent on any contract.
12
Below is a table showing the percentage of our net sales to our top 10 customers in 2025:
| Customer | Percentage of Net Sales during 2025 | ||||
| Samsung Electronics Co., Ltd. | 11% | ||||
| Taiwan Semiconductor Manufacturing Company Limited | 8% | ||||
| Remaining top 10 customers | 15% | ||||
| Total top 10 customers | 34% | ||||
Selling & Marketing
We prioritize a customer-focused and technically skilled sales and marketing organization, operating both directly and through a global network of distributors. Our commercial teams possess strong technical expertise, extensive local market insights and a proven track record of fostering lasting customer relationships.
Our unique capabilities and long-standing industry relationships enable significant collaboration with our customers, which, in turn, enhances our ability to innovate and introduce new materials and solutions that address the evolving needs of the market. We are dedicated to identifying and resolving challenges faced by our customers that can be met with our solutions. Our sales representatives provide comprehensive technical support, accessible both locally and globally.
Manufacturing & Facilities
Our global operational footprint is strategically designed to promote optimal collaboration with our customers while leveraging the expertise of our global specialists. This geographical coverage not only allows us to address the local and regional needs of our customers but also enhances our ability to deliver customized solutions quickly. Our extensive global footprint underscores our commitment to maintaining a global presence, connecting customers with global experts and fostering innovation through close-knit collaborative efforts.
Customers trust our products and materials to uphold the integrity of the critical materials used in their manufacturing processes. We achieve this by delivering products with highest purity, cleanliness, consistent performance, dimensional precision and stability. Our capability to meet customers’ expectations, coupled with substantial investments in global manufacturing capacity and comprehensive supply chain strategy, positions us to effectively respond to the growing demands for yield-enhancing materials and solutions.
Research and Development
Innovation is at the heart of our culture and a key driver of our success. Our research and development efforts are centered on advancing and enhancing our technology platforms for semiconductor and advanced processing applications, as well as identifying and developing products for new applications. We often collaborate closely with our customers to address their specific needs.
Our research and development initiatives emphasize cutting-edge technology in advanced nodes and critical solutions within advanced electronics, including thermal management and signal integrity.
We have research and development capabilities strategically located in key regions where our customers operate, including Taiwan, South Korea, China, Japan, Europe and North America. In 2025, our research and development expenses totaled $354 million. We accelerate the introduction of new products and enhance their relevance in local markets through strategic collaboration with academic institutions, commercial partners and OEMs. Our global technical service teams actively engage with customers to develop customized application solutions, and we are committed to sustaining significant investments across our diverse research and development initiatives.
Intellectual Property
We differentially manage the intellectual property estates to support our strategic priorities, which can include leveraging intellectual property within and across product lines. We protect our trade secrets and confidential know-how by actively enforcing our internal policies for data classification and protection, by requiring and enforcing specific innovation and proprietary information agreements and non-disclosure agreements with our employees and third parties and through a combination of patents, trademarks, confidentiality procedures and other legal and contractual rights. We also utilize contemporary cybersecurity tools and systems to protect our most valuable data from insider threats and third-party concentrated efforts to misappropriate our intellectual property. Our cybersecurity tools and systems protect our data by requiring enhanced access and use of multiple authentication methods, encrypting information and providing secure, monitored
13
environments to reduce their vulnerability to cyber threats. While we believe that our intellectual property estate, taken as a whole, provides a competitive advantage in many of our businesses, no single patent, trademark, license or group of related patents, trademarks or licenses is in itself essential to us as a whole or to any of our businesses.
Trade Secrets: Trade secrets are an important part of our intellectual property. Many of the processes we use to make products are kept as trade secrets which, from time to time, may be licensed to third parties. We vigilantly protect all intellectual property, including trade secrets. When we discover that trade secrets have been unlawfully taken, we report the matter to governmental authorities for investigation and potential criminal action, as appropriate. In addition, we take measures to mitigate any potential impact, which may include civil actions seeking redress, restitution and/or damages based on loss and/or unjust enrichment.
Patents: We apply for and obtain patents in many countries, including the U.S., and have access to a large patent portfolio, both owned and licensed. Our rights under these patents and licenses, as well as the products made and sold under them, are important to us. We consider various intellectual property protections and strategic business priorities when deciding whether to apply for or maintain a patent.
The protection afforded by patents varies based on country, scope of individual patent coverage, as well as the availability of legal remedies in each country and type of patent protection. The term of these patents is approximately 20 years from the filing date in general but varies depending on country and type of patent protection. Based on our patent estate at December 31, 2025, we hold about 7,000 patents and patent applications globally. At December 31, 2025, approximately 70% of our patent portfolio consisted of issued patents; the remainder consisted of pending patent applications. Approximately 80% of our patent portfolio has a remaining term of more than five years as of December 31, 2025.
Trademarks: We own or license many tradenames, trademarks and trademark registrations in the U.S. and other countries that have significant recognition in the industry sectors we serve. Ownership rights in trademarks do not expire if the trademarks are continued in use and properly protected.
Raw Materials
Qnity uses a wide variety of raw materials in the manufacturing of products, including intermediates, polymers, resins, metals and other specialty chemicals. The prices of raw materials are driven by global supply and demand and we at times have been affected by upward price pressure on the raw materials we purchase due to changes in commodity pricing. Supply chain disruptions, resulting in supply shortages and higher shipping charges, have impacted our suppliers and could continue to impact our ability to maintain supplies of products and the costs associated with obtaining raw materials. We strategically source most of these raw materials from local suppliers, with approximately 70% of our raw materials sourced from within the local country. We maintain close working relationships with them to ensure a steady flow of high-quality inputs that meet our stringent performance and reliability requirements. Our approach is aimed at achieving a balance of price, reliability and resilience in our supply chain.
Seasonality
Certain of our sales are seasonal as consumer electronics end-market demand generally increases in the second and third fiscal quarters, resulting in sales increases primarily in Interconnect Solutions; although this seasonality pattern has decreased over the past few years and we expect this seasonality to further diminish going forward.
Employees
Foundational to the Company’s current and future success is our more than 10,000 employee-strong work force, driving the realization of our strategic vision. We focus significant attention on attracting, motivating and retaining talent at all levels and strive to create an environment that fully supports the needs of our employees while also providing opportunities for career growth and financial rewards. We also seek to provide an inclusive and collegial experience and to motivate our employees with work that is challenging, exciting and important.
We believe that the growth of our people is essential to the growth of our business. We offer a wide range of training, education and development opportunities, both formally and informally, throughout the year. All employees take part in a mix of on-the-job training and are given appropriate learning and training opportunities that focus on topics critical and relevant to each employee’s job function. We believe our employees have the freedom to create meaningful development plans, identify goals and take steps to achieve them.
Our success also depends on the well-being of our employees, which includes physical, mental and emotional health. We provide benefits and resources to support our employees’ well-being, including by embracing workplace flexibility wherever possible, recognizing that different people, jobs and teams have different needs.
14
Some of our employees are affiliated with labor unions or represented by works councils. We prioritize positive relationships with our employees and collective bargaining representatives.
As of December 31, 2025, of our more than 10,000 employees, approximately 60% are located in Asia Pacific; 32% are located in the U.S. and Canada; 5% are located in Europe, Middle East and Africa ("EMEA") and 3% are located in Latin America.
Competitive Landscape
Competition in the markets in which we participate is through a range of products and services, based upon performance, quality, reliability, brand, reputation, service and support. We provide extensive support, technical services and testing services for our customers, in addition to new product development. The electronics materials market is subject to rapid technological advancements and shifting customer demands. The constantly evolving landscape requires focused innovation to remain at the forefront of performance, product quality and supply reliability. The industry is increasingly driven by trends such as supply chain localization, cost optimization and sustainability, which present both challenges and opportunities. As one of the largest electronics material providers, we bring the ability to innovate, manufacture and co-develop solutions, which positions us to compete effectively across broad end markets. Our competitors range from large multinational corporations to small regional players, specializing in niche markets. Our most notable competitors are Entegris, Merck KGA, Resonac, Element Solutions and MKS Instruments.
Regulatory Considerations
The regulatory environment in which we operate is robust and evolving in response to, among other actions, geopolitical forces, technological developments and societal concerns. Our businesses and operations are affected by global laws, regulations and standards. Our production cycle and products are subject to global regulations, such as permitting, quality controls, environmental, health and safety laws and regulations, export control laws, product specifications, market-related policies and distributions regulations. We believe that we maintain processes and procedures that comply with applicable global laws and regulations as they pertain to the various stages of our production life cycle, including the development of our products. However, new, modified or more stringent requirements or enforcement policies could be adopted, which could adversely affect us. Our ability to market, sell and distribute our products globally depends upon our compliance with law and regulations in each jurisdiction. See "Item1A. Risk Factors” for a more detailed description of the regulatory risks we face.
Available Information
The Company is subject to the reporting requirements under the Securities Exchange Act of 1934. Consequently, the Company is required to file reports and information with the SEC, including reports on the following forms: annual report on Form 10-K, quarterly reports on Form 10-Q, current reports on Form 8-K, and amendments to those reports filed or furnished pursuant to Section 13(a) or 15(d) of the Securities Exchange Act of 1934.
The SEC maintains an Internet site at http://www.sec.gov that contains reports, proxy and information statements, and other information regarding issuers that file electronically with the SEC, from which the public may obtain any materials the Company files with the SEC.
The Company's annual report on Form 10-K, quarterly reports on Form 10-Q, current reports on Form 8-K and amendments to those reports are also accessible on Qnity's website at http://.ir.qnityelectronics.com by clicking on the section labeled "SEC Filings". These reports are made available, without charge, as soon as is reasonably practicable after the Company files or furnishes them electronically with the SEC.
Qnity webcasts its quarterly earnings calls and certain events it participates in or hosts with members of the investment community under the Events and Presentation section, in the "Investors" section of the Company’s website. Additionally, Qnity provides notifications of news or announcements regarding its financial performance, including SEC filings, investor events, news and earnings releases under "Investors".
15
ITEM 1A. RISK FACTORS
RISK FACTORS
You should carefully consider the following risks and other information in this Annual Report on Form 10-K in evaluating us and our common stock.
Any of the following risks, as well as additional risks and uncertainties not currently known to us, beyond our control or that we currently deem immaterial, could materially and adversely affect our business, results of operations or financial condition. Based on current information, we believe that the following identifies the most significant risks that could affect our business, results of operations or financial condition.
Risks Related to Our Business
Our results are affected by competitive conditions and customer preferences.
We operate in a highly competitive, global industry. Some of our competitors may have better-established customer relationships than we do, which may enable them to have their products specified for use more frequently and more quickly by these customers. Further, customers continually evaluate the benefits of internal manufacturing versus outsourcing, and a customer’s decision to internally manufacture products that we provide may negatively impact us. If we are unable to maintain our competitive position, we could experience downward pressure on prices, fewer customer orders, reduced margins, the inability to take advantage of new business opportunities and a loss of market share, any of which could have a material adverse effect on our results of operations. Further, we expect that existing and new competitors will improve their products and introduce new products with enhanced performance characteristics. The introduction of new products, more efficient production of existing products, or products sold at a lower cost by competitors could diminish our market share and increase pricing pressure on our products. Our competitors include companies outside of the U.S., including companies in countries where foreign governments seek to build a domestic-centric semiconductor ecosystem. From time to time, governments around the world may provide incentives or make other investments that could benefit and give competitive advantages to our competitors. Government incentives may not be available to us on acceptable terms or at all. If our competitors can benefit from such government incentives and we cannot, it could strengthen our competitors’ relative position and have a material adverse effect on our business.
We expect the demand for product offerings that align with sustainability goals (in areas such as substances of concern, circular economy, waste, water, nature/biodiversity, responsible procurement, human rights) to continue to increase, driven by end-user and customer demand, investor preference and government legislative and market-responsive product-specific actions. Failure to timely react to these trends and manage our product portfolio and innovation activities responsively could decrease the competitiveness of our products and result in the de-selection of us as a partner of choice.
Fluctuations in the demand for semiconductors and the overall volume of semiconductor manufacturing may decrease demand for our products and may adversely affect our business.
Our revenue is heavily dependent on demand from the global semiconductor ecosystem. The semiconductor industry has historically been, and is likely to continue to be, cyclical, with periodic downturns, resulting in decreased demand for our products. The semiconductor industry may be negatively impacted by factors such as decreased consumer spending, macroeconomic uncertainty and slow or negative economic growth, which could further decrease consumer spending and business investment in technologies and products that contain semiconductors. We have previously experienced a reduction in revenue and operating losses during cyclical downturns in the semiconductor industry, which can occur suddenly. During such cyclical downturns, we typically experience greater pricing pressure and shifts in product and customer mix, which can adversely affect our gross margin and net income. We are unable to predict the timing, duration or severity of any current or future downturns in the semiconductor industry. Furthermore, the semiconductor industry is subject to rapid advancements and demand for new and emerging technologies, such as artificial intelligence. Additionally, we may incur unexpected or additional costs to align our operations with demand. If we do not, or are unable to, adequately anticipate changes in our business environment, we may lack the infrastructure, manufacturing capacity and resources to scale up our business to meet customer expectations and compete successfully during a period of growth. Conversely, we may expand our capacity too rapidly, resulting in excess fixed costs, and lower profitability.
If we are unable to anticipate and respond to rapid technological change and customer requirements by continuing to innovate and introduce new and enhanced products and solutions, we may experience a loss of market share, decreased sales, revenue, profitability and damage to our reputation.
The electronics industry is subject to rapid technological change, changing customer requirements and frequent new product introductions. In our industry, the first company to introduce an innovative product that addresses an identified market need will often have a significant advantage over competing products. A failure to successfully anticipate and respond to technological
16
changes by developing, marketing and manufacturing new products or enhancements to our existing products could harm our business prospects and significantly reduce our sales. Conversely, if a product concept does not progress beyond the development stage or only achieves limited acceptance in the marketplace, we may not receive a direct return on our expenditures, we may lose market share and our revenue and profitability may decline. Following development, it may take several years for sales of a new product to reach a substantial level, if ever. We cannot guarantee that the new products and technology we choose to develop and market will be successful. In addition, if new products have reliability or quality problems, we may experience reduced orders, higher manufacturing costs, delays in acceptance and payment, additional service and warranty expense and damage to our reputation.
A large percentage of our net sales are generated from our international operations and are subject to economic, geopolitical, foreign exchange and other risks.
We do business globally in approximately 80 countries. The percentage of net sales generated by international operations, including U.S. exports, was approximately 88% of our total net sales for the year ended December 31, 2025. Regionally, Asia Pacific represented approximately 79% of our net sales for the year ended December 31, 2025. We expect that the percentage of our net sales derived from international operations will continue to be significant.
Risks related to international operations that have adversely impacted and may continue to adversely impact our business, results of operations and reputation as well as our customers and suppliers include:
•economic uncertainty in the worldwide markets in which we operate;
•trade restrictions (including potential, new and changing regulations for exports of certain technologies and goods to China) and changes in tariffs;
•failure to comply with evolving international trade restrictions and economic sanctions, laws and regulations;
•positions taken by governmental agencies regarding possible national, commercial and/or security issues posed by the development, sale or export of certain raw materials, products and technologies;
•geopolitical tensions or conflicts, which may result in severely diminished liquidity and credit availability, rating downgrades of sovereign debt, declining valuation of certain investments, declines in consumer confidence, declines in economic growth, volatility in unemployment rates, increased logistics costs and delays and uncertainty about economic stability and raw materials;
•difficulty in staffing and managing widespread operations;
•differing labor regulations;
•challenges of maintaining appropriate business processes, procedures and internal controls and complying with legal, environmental, health and safety, anti-bribery, anti-corruption, data privacy, cybersecurity and other regulatory requirements that vary by jurisdiction, and the impact of improper conduct by our employees, agents or business partners;
•challenges in developing relationships with local customers, suppliers and governments;
•fluctuating pricing and availability of raw materials and supply chain disruptions;
•changes in global or local economic conditions, including inflation, hyperinflation, fluctuations in interest rates and other increasing price levels in certain sectors, such as energy, impacting availability and cost of goods and services;
•public health crises and related implications thereof;
•expense and complexity of complying with U.S. and foreign import and export regulations, including the ability to obtain and renew required import and export licenses;
•fluctuations in interest rates and currency exchange rates, including the relative strength or weakness of the U.S. dollar against foreign currencies that are important to our business;
•restrictions on the transfer of funds, potentially leading to the inability to readily repatriate earnings from foreign operations effectively;
•tax impacts and changes in global and local tax regulatory environments;
•challenges and costs associated with the protection of our intellectual property throughout the world;
•challenges associated with managing global and regional third-party service providers, including certain engineering, software development, manufacturing, information technology ("IT") and other functions; and
•customer or government efforts to encourage operations and sourcing in a particular country, including efforts to develop and grow local competitors, require local manufacturing and provide special incentives to government-backed local customers to buy from local competitors.
17
We are subject to a variety of rapidly evolving environmental laws and regulations that could cause us to incur significant liabilities and expenses and subject us to environmental litigation.
We are subject to extensive federal, state, local and foreign laws, regulations, rules, ordinances and permit requirements relating to pollution, protection of the environment, product content, greenhouse gas emissions, and the generation, storage, handling, transportation, treatment, disposal and remediation of hazardous substances, which include certain substances of concern, and waste materials, which are rapidly evolving. Costs to comply with complex environmental laws and regulations, as well as internal voluntary programs and goals, are significant and we expect these costs will continue to be significant for the foreseeable future. Moreover, changes in the legal or regulatory environment could inhibit or interrupt our operations, require modifications to our products, processes or facilities or cause us to discontinue or relocate the production of certain products. Further changes to or our failure to comply with these and similar regulations may result in significant unanticipated costs, liabilities or capital expenditures or require changes in business practice that could result in reduced margins or profitability.
As a result of our operations, including past operations and those related to divested businesses and discontinued operations of DuPont and certain of our former affiliates (and their respective former affiliates), which will generally be contractually allocated between us and DuPont based on the Applicable Percentages under the Separation and Distribution Agreement (the "Separation and Distribution Agreement"), described in Item 7. Management's Discussion and Analysis of Financial Condition and Results of Operations" in this Annual Report, we incur environmental operating costs for pollution abatement activities including waste collection and disposal, installation and maintenance of air pollution controls and wastewater treatment, emissions testing and monitoring and obtaining permits. We also incur environmental operating costs related to environmental-related research and development activities including environmental field and treatment studies as well as toxicity and degradation testing to evaluate the environmental impact of products and raw materials. In addition, we maintain and periodically review and adjust our accruals for probable environmental remediation and restoration costs. Considerable uncertainty exists with respect to environmental remediation costs and, under adverse changes in circumstances, the potential liability may be materially higher than our accruals.
We face risks arising from various unasserted and asserted litigation matters arising out of the normal course of our current and former business operations, including intellectual property, commercial, product liability, environmental and antitrust lawsuits. We have noted a trend in public and private suits being filed on behalf of states, counties, cities and utilities alleging harm to the general public and the environment, including waterways and watersheds. It is not possible to predict the outcome of these various proceedings. An adverse outcome in any one or more of these matters could be material to our financial results. Various factors or developments can lead to changes in current estimates of liabilities. Such factors and developments may include, but are not limited to, additional data, safety or risk assessments, as well as a final adverse judgment, significant settlement or changes in applicable law. A future adverse ruling or unfavorable development could result in future charges that could have a material adverse effect on us.
Supply chain and operational disruptions and volatility in energy and raw material costs could adversely impact our sales and earnings and impact access to sources of liquidity.
Our manufacturing processes and operations depend on the continued availability of energy and raw materials, the costs of which are subject to worldwide supply and demand as well as other factors beyond our control, including potential legislation related to reducing greenhouse gas emissions, the introduction of tariffs, creating a carbon tax or implementing a cap and trade program which could create increases in costs and price volatility. Climate change increases the frequency and severity of potential supply chain and operational disruptions from weather events and natural disasters. The chronic physical impacts associated with increased temperatures, changes in weather patterns and rising sea levels, for example, could significantly increase costs and expenses and create additional supply chain and operational disruption risks.
Supply chain disruptions, including as a result of the relocation of certain low-cost and limited source suppliers to less-developed countries, plant and/or power outages, labor shortages and/or strikes, geopolitical activity, tariffs, weather events and natural disasters, including hurricanes or flooding that impact coastal regions, and global health risks or pandemics could seriously harm our operations as well as the operations of our customers and suppliers. Our manufacturing operations may be adversely affected by impacts of pandemics including government actions and other responsive measures, quarantines and health and availability of essential onsite personnel. In addition, our suppliers may experience capacity limitations in their own operations or may elect to reduce or eliminate certain product lines. To address this risk, generally, we seek to have many sources of supply for key raw materials in order to avoid significant dependence on one or a few suppliers. In addition, and where the supply market for key raw materials is concentrated, we take additional steps to manage exposure to supply chain risk and price fluctuations through, among other things, negotiated long-term contracts some of which include minimum purchase obligations. However, there can be no assurance that such mitigation efforts will prevent future difficulty in obtaining sufficient and timely delivery of certain raw materials.
18
If we do not successfully execute our go-to-market strategy, our business and financial performance may suffer.
Our go-to-market strategy is focused on leveraging our existing portfolio of products and services as well as introducing new products and services to meet the demands of our customers in a continually changing technological landscape. To successfully execute this strategy, we must emphasize the aspects of our core business where demand remains strong, identify and capitalize on organic growth, and innovate by developing new products and services that will enable us to expand beyond our existing technology categories. Any failure to successfully execute this strategy, including any failure to invest sufficiently in strategic growth areas and support our research and development activities, could adversely affect our business, financial condition or results of operations.
Changes in the global and local tax regulatory environments in, and the distribution of income among, the various jurisdictions in which we operate, could adversely impact our results of operations.
Our future results of operations could be adversely affected by changes in the effective tax rate as a result of a change in the mix of earnings in countries with differing statutory tax rates, changes in tax laws, regulations and judicial rulings (or changes in the interpretation thereof), changes in United States Generally Accepted Accounting Principles, changes in the valuation of deferred tax assets and liabilities, changes in the amount of earnings permanently reinvested offshore, the results of audits and examinations of previously filed tax returns and continuing assessments of our tax exposures and various other governmental enforcement initiatives. We have ongoing federal, state and international income tax audits in various jurisdictions, and we evaluate uncertain tax positions that may be challenged by local tax authorities. The impact, if any, of these audits to our unrecognized tax benefits is not estimable. Our tax expense includes estimates of tax reserves and reflects other estimates and assumptions, including assessments of our future earnings which could impact the valuation of our deferred tax assets.
On August 16, 2022, the Inflation Reduction Act of 2022 (the “IRA”) was enacted in the United States and imposes a 15% corporate alternative minimum tax (“CAMT”) on certain corporations. We continue to monitor the impact and risk of this on our future effective tax rate.
On July 4, 2025, the One Big Beautiful Bill Act (the “OBBBA”) OBBBA was enacted into law in the United States. The OBBBA modifies international corporate income tax law by, among other things, changing the tax rates for certain Global Intangible Low-Taxed Income (now known as Net CFC Tested Income) and Foreign-Derived Intangible Income (now known as Foreign Derived Deduction Eligible Income), modifying the allocation of expenses in calculating foreign tax credits, as well as changing foreign tax credit limitations. Given the complexities of the changes and potential future clarifications of the provisions, we continue to evaluate the impact of the new legislation on future periods.
Changes in tax laws or regulations, including multi-jurisdictional changes enacted in response to the action items provided by the Organisation for Economic Co-operation and Development (the "OECD"), including the OECD’s Global Anti-Base Erosion rules under Pillar Two, which introduces a global minimum corporate tax rate set at 15% on multinational enterprises, can increase tax uncertainty and may impact our provision for income taxes. Many countries have enacted or drafted legislation using the Pillar Two framework to implement domestic tax laws requiring a minimum tax rate of 15% (“domestic top-up tax”) on income earned in the respective countries. The introduction of Pillar Two in countries where the Company operates has negatively impacted and may continue to negatively impact our effective tax rate. While the OECD released guidance on January 5, 2026 detailing a “side-by-side” framework that could exempt certain U.S.-parented groups, including Qnity, from certain of the Pillar Two rules, the final outcome remains uncertain. Given the unpredictability of possible further changes to and the potential interdependency of the United States or foreign tax laws and regulations, it is difficult to predict the cumulative effect of such tax laws and regulations on our results of operations.
If we are unable to attract or retain key personnel and qualified employees, or maintain relations with our employees, unions and other employee representatives, it could adversely affect our ability to compete and achieve our strategic goals.
Attracting, developing and retaining talented employees is essential to our successful delivery of products and services, ability to innovate, and ability to identify trends and develop new markets. Many of our key personnel have significant experience in the semiconductor industry and deep technical expertise. In addition, due to the specialized and technical nature of our business, our future performance depends upon our ability to attract, develop and retain skilled employees, particularly specialized research and development and engineering personnel, in order to maintain our efficient production processes, drive innovation in our product offerings and maintain our deep customer relationships. As the semiconductor industry has grown in recent years, competition for qualified talent, particularly those with significant industry experience, has intensified. We may be required to increase salary and/or benefits to attract and retain top performers which could increase our costs and adversely impact our results of operations.
19
Certain of our employees in the U.S. are covered by collective bargaining agreements. These agreements typically contain provisions regarding the general working conditions of our employees, including provisions that could affect our ability to restructure our operations, close facilities or reduce our number of employees. We may not be able to extend existing collective bargaining agreements or, upon the expiration of such agreements, negotiate such agreements in a favorable and timely manner or without work stoppages, strikes or similar actions.
The loss of one or more key employees, our inability to successfully integrate, motivate and reward our employees, attract or develop additional qualified employees, any delay in hiring key personnel, any deterioration of the relationships with our employees, unions and other employee representatives, or any material work stoppage, strike or similar action could have a material adverse effect on our business results, cash flows, financial condition or prospects.
Our reliance on certain key customers, contract manufacturers and suppliers could adversely affect our overall sales and profitability.
Sales to a limited number of large customers constitute a significant portion of our overall revenue, shipments, cash flows, collections and profitability. Our top ten customers accounted for 34%, 34% and 32% of our net sales in 2025, 2024 and 2023, respectively. We would have no or limited contractual recourse if our large customers decided to stop buying and using our products in their manufacturing processes with limited advance notice to us. The cancellation, reduction or deferral of purchases of our products by any one of these customers could meaningfully reduce our revenues. The loss of one or more of these key customers, if our products are not specified for our large customers’ products or if we suffer a material reduction in their purchase orders, could impair our results of operations for the affected earnings periods. In addition, there is limited available manufacturing capacity that meets our quality standards and regulatory requirements. If we are unable to arrange for sufficient production capacity among our suppliers or contract manufacturers, or if our suppliers or contract manufacturers encounter production, quality, financial or other difficulties (including due to labor or geopolitical disturbances or natural disasters), we may be unable to meet our customers’ demands. To help ensure continuity of supply to our customers, we have increased our procurement efforts to shorten lead times. These increases in materials inventory and purchase commitments have resulted, and could continue to result, in excess and/or obsolete inventory charges if the demand for our products is ultimately less than our expectations. Finally, we rely on independent distributors to distribute our products and to assist us with the marketing and sale of certain of our products. There can be no assurance that our distributors will focus adequate resources on selling our products to end users, or will be successful in selling our products, which could materially adversely affect our business and results of operations.
Risks related to trade disputes, regulations and policies could have an adverse impact on our operations and reduce the competitiveness or availability of our products relative to local and global competitors.
There is inherent risk, based on the complex relationships among China, Japan, South Korea, Taiwan and the U.S., that political, diplomatic and national security influences could lead to trade disputes, impacts and/or disruptions, in particular those affecting the semiconductor industry. Trade regulations, policies and disputes can and have increased tariffs and trade barriers, which can and have limited our ability to sell certain products to certain customers, and otherwise impacted our global supply and distribution chains and research and development activities, particularly those arising out of relations between the U.S. and China. The extent and duration of the tariffs and the resulting impact on general economic conditions and on our business are uncertain and depend on various factors, such as negotiations between the U.S. and affected countries, the responses of other countries or regions, exemptions or exclusions that may be granted, availability and cost of alternative sources of raw materials, and our buying organization’s ability to execute our raw materials sourcing model to offset the effects of the tariffs. In addition, we are subject to export control and economic sanctions laws and regulations that restrict the delivery of some of our products and services to certain countries (and nationals thereof), to certain end users, and for certain end uses. These restrictions may prohibit the transfer of certain of our products, services and technologies, and they may require us to obtain a license from the U.S. government before delivering the controlled item or service. Obtaining export licenses may be difficult, costly and time-consuming, and we may fail to receive licenses that we apply for on a timely basis or at all. We must also comply with export control and economic sanctions laws and regulations imposed by other countries. Our export and trade control compliance program may be ineffective or circumvented, exposing us to legal liabilities. Compliance with these laws could meaningfully limit our sales in the future. Ultimately, changes in, and responses to, U.S. trade controls have the potential to reduce the competitiveness of our products and cause our sales to decline, which could have a material adverse effect on our business, financial condition and results of operations. Such risks may be especially exacerbated as they relate to China, a market that is important to our business, representing approximately 33% of our net sales for the year ended December 31, 2025.
20
Our business, results of operations and reputation could be adversely affected by industry-specific risks, including process safety, product stewardship and regulatory compliance issues.
Our business exposes us to industry-specific risks which include, but are not limited to risks arising from: product safety or quality, shifting public perception, federal, state and local regulations on manufacturing or labeling, packaging, environmental, health and safety laws and regulations and customer product liability claims.
In most jurisdictions, we must test the safety, efficacy and environmental impact of our products to satisfy regulatory requirements and obtain the needed approvals. In certain jurisdictions, we must periodically renew our approvals, which may require us to demonstrate compliance with then-current standards. The regulatory approvals process is lengthy, complex and in some markets unpredictable, with requirements that can vary by product, technology, industry and country. Regulatory standards and trial procedures are continuously changing in response to technological developments, changes in legislation and governmental, non-governmental organization (“NGO”) and societal demands for increasing levels of product safety and environmental protection. The pace of change, together with any lack of regulatory harmony could result in unintended noncompliance. Each of these laws, rules and regulations imposes costs on our business, including financial costs and potential diversion of our management’s attention, and may present risks to our business, including potential fines, restrictions on our actions and reputational damage if we do not fully comply. To maintain our right to produce or sell existing products or to commercialize new products, we must be able to demonstrate our ability to satisfy the requirements of regulatory agencies, industries and customers.
Efforts to comply with new and changing regulations have resulted in, and are likely to continue to result in, increased administrative expenses and diversion of management’s time and attention from revenue-generating activities to compliance activities. The failure to meet existing and new requirements or receive necessary permits or approvals could have near- and long-term effects on our ability to produce and sell certain current and future products which could increase operating costs and adversely affect our business, results of operations and financial condition. In addition, negative publicity related to product liability, safety, health and environmental matters may damage our reputation.
Our business, results of operations, financial condition and cash flows could be adversely affected by interruption or regulation of our information technology or network systems and storage of information and other business disruptions. Our actual or perceived failure to comply with laws and regulations regarding data privacy could also lead to regulatory investigations, litigation, fines, or other adverse business consequences.
We rely on centralized and local information technology and physical networks and systems, some of which are managed or accessible by third parties, to process, transmit and store electronic information and to otherwise manage or support our business. Additionally, we collect, store, process, use and have access to certain data, including proprietary business and personal information or data that is subject to privacy and security laws, regulations, orders and controls or rules imposed by customer or other contracts. The processing and storage of personal information is increasingly subject to privacy and data security regulations, and many such regulations are country or territory-specific. The interpretation and application of data protection laws in the U.S., Europe, Asia Pacific, Latin America and elsewhere are continuing to evolve and may be different across these jurisdictions. Violations of these laws or standards could result in criminal or civil sanctions, investigations or enforcement actions. Even the mere allegation of such violations, could harm our ability to do business, our results of operations, financial position and reputation.
Information technology system and/or network disruptions, whether caused by internal or external factors, could have an adverse impact on our operations as well as the operations of our customers and suppliers. Other business disruptions may also be caused by security breaches. We and/or our suppliers may fail to effectively prevent, detect and recover from security breaches and, therefore, such breaches could result in misuse of our assets, loss of property including trade secrets and confidential or personal information, and other business disruptions. As a result, we may be subject to legal claims or proceedings, reporting errors, processing inefficiencies, negative media attention, loss of sales, interference with regulatory compliance, which could result in sanctions or penalties, liability or penalties under privacy laws, disruption in our operations and damage to our reputation, which could adversely affect our business, results of operations, financial condition and cash flows.
Like other major corporations, we are the target of cyber-attacks, from time to time, which include phishing, spam emails, hacking, social engineering, industrial espionage and malicious software. We have determined that these attacks have resulted, and could result in the future, in unauthorized parties gaining access to certain confidential business information. However, risks from previous cybersecurity incidents, have not materially affected us, including our business strategy and results of operations. Further, the use of artificial intelligence by us, our customers, suppliers and other business partners and third-party providers may further introduce vulnerabilities onto our IT systems and data.
21
We seek to actively manage the risks within our control that could lead to business disruptions and security breaches. As these threats continue to evolve, we may be required to expend significant resources to enhance our control environment, processes, practices and other protective measures. Despite these efforts, such events could have a material adverse effect on our business, results of operations, financial condition and cash flows.
Our revenues and operating results have fluctuated in the past and may do so in the future, which could impact our stock price.
Our revenues and operating results may fluctuate significantly from quarter-to-quarter or year-to-year due to a number of factors, many of which are outside our control. We manage our expenses based in part on our expectations of future revenues. Because some of our expenses are relatively fixed in the short term, a change in the timing of revenue or the amount of profit we generate from a small number of transactions can unfavorably affect operating results in a particular period. Factors that may cause our financial results to fluctuate unpredictably include:
•our ability to develop, introduce and market new, enhanced and competitive products in a timely manner;
•trends in the semiconductor industry, macroeconomic and market conditions and geopolitical uncertainty;
•legal, tax, accounting or regulatory changes (including changes in import/export regulations and tariffs, such as regulations imposed by the U.S. government on product imports from certain countries, including China and Mexico, as well as the related trade disputes and trade barriers) or changes in the interpretation or enforcement of existing requirements;
•the size and timing of customer orders;
•consolidation of our customers, which could impact their purchasing decisions and negatively affect our revenues;
•procurement shortages, increased prices, the failure of suppliers to perform their obligations and additional expenses to respond promptly to any supply shortages or other supplier problems;
•decisions to increase or accelerate our purchasing of raw materials, components or other supplies in an effort to mitigate supply risk;
•changes in our capital expenditure requirements, and the schedule and timing, including potential delays, thereof;
•manufacturing difficulties;
•customer decisions to decelerate orders in order to draw down their inventory;
•customer cancellations of or delays in shipments, installations or customer acceptances or, alternatively, acceleration of orders from customers to increase their inventory;
•our customers’ rate of replacement of our consumable products or decision to delay expansion projects;
•changes in average selling prices, customer mix and product mix;
•our competitors’ introduction of new products;
•disruptions in transportation, communication, demand, information technology or supply, including strikes, acts of God, wars, terrorist activities and natural or man-made disasters;
•changes in our estimated tax rate; and
•foreign currency exchange rate fluctuations.
Enforcing our intellectual property rights, or defending against intellectual property claims asserted by others, could adversely affect our business, results of operations, financial condition and cash flows.
Intellectual property rights, including patents, trade secrets, know-how and confidential information, trademarks, tradenames and trade dress, are important to our business. We endeavor to protect our business, including our products, processes and services, by protecting and enforcing our intellectual property rights under the intellectual property laws of certain jurisdictions around the world. However, we may be unable to protect or enforce our intellectual property rights in key jurisdictions for various reasons including government policies and regulations. Further, changes in government policies and regulations, including changes made in reaction to pressure from NGOs, or the public generally, could impact the extent of intellectual property protection afforded by such jurisdictions.
We have designed and implemented internal controls intended to restrict unauthorized access to and use of our intellectual property, including our trade secrets and confidential information. Despite these precautions, our intellectual property is vulnerable to infringement, misappropriation and other unauthorized access and use, including through employee or licensee error or actions, theft by employees or third parties and cybersecurity incidents and other security breaches. When unauthorized access and use or counterfeit products are discovered, we report such incidents to governmental authorities for investigation, as appropriate, and take measures intended to mitigate any potential impact and to stop any unauthorized access.
Third parties may also claim our products, processes or services, or our names and marks, including new names and marks adopted by us in connection with our recent spin-off from DuPont (the "Spin-Off"), violate their intellectual property rights. Defending such claims, even those without merit, can be time-consuming and expensive. In addition, as a result of such claims, we and/or certain of our subsidiaries have been, and may in the future be, required to enter into license agreements, modify the
22
design of our products, processes or services, rebrand our offerings or cease the sale or other commercial exploitation of the affected products, services or brands. If challenges are resolved adversely, it could negatively impact our ability to obtain licenses on competitive terms, commercialize new products and generate sales from existing products, and we could become liable for damages.
Any one or more of the above factors could significantly affect our business, results of operations, financial condition and cash flows.
Failure to effectively manage acquisitions, divestitures, partnerships and other portfolio actions could adversely impact our business, results of operations, financial condition and cash flows.
We continuously evaluate acquisition candidates that may strategically fit our business and/or growth objectives. If we are unable to successfully integrate and develop acquired businesses, we could fail to achieve anticipated synergies and cost savings, including any expected increases in revenues and operating results, which could have a material adverse effect on our financial results. We expect to continually review our portfolio of assets for contributions to our objectives and alignment with our growth strategy. Moreover, we might incur asset impairment charges related to acquisitions or divestitures that reduce our earnings. In addition, if the execution or implementation of acquisitions, divestitures, partnerships, joint ventures and other portfolio actions is not successful and/or we fail to effectively manage cost as our portfolio evolves, it could adversely impact our business, results of operations, financial condition and cash flows.
We may not be able to access the capital and credit markets on terms that are favorable to us, or at all.
Our business relies in part on the availability of financing for our products and services. The capital and credit markets may experience extreme volatility or disruptions that may lead to uncertainty and liquidity issues for both borrowers and investors. Certain customers and suppliers, as well as our business, may need access to credit and trade finance lines and other financing instruments for certain transactions and to provide financial assurance as required by regulatory agencies. Additionally, we may need to access the capital markets to supplement our existing funds and cash generated from operations to satisfy our needs for example, for working capital or capital expenditure requirements. A variety of factors beyond our control could impact the availability or cost of capital, including domestic or international economic conditions, increases in key benchmark interest rates and/or credit spreads, the adoption of new or amended banking or capital market laws or regulations, and the repricing of market risks and volatility in capital and financial markets. In the event of adverse capital and credit market conditions, we may be unable to obtain capital market financing on favorable terms, or at all, and changes in credit ratings issued by nationally recognized credit-rating agencies could adversely affect our ability to obtain capital market financing and the cost of such financing. Additionally, a large portion of our total consolidated cash is held overseas and may not be efficiently accessible to finance or to otherwise support our capital market requirements. Such factors may impact our ability, or the ability of our customers or suppliers, to obtain debt financing, guarantees or hedging from financial institutions which may negatively impact our business.
Risks Related to our Recent Spin-Off from DuPont
We may be unable to achieve some or all of the benefits that we expect to achieve from the Spin-Off.
We believe that, as an independent, publicly traded company, we are better positioned to, among other things: focus our financial and operational resources on our specific business, growth profile and strategic priorities; design and implement corporate strategies and policies targeted to our operational focus and strategic priorities; guide our processes and infrastructure to focus on our core strengths; implement and maintain a capital structure designed to meet our specific needs; and more effectively respond to industry dynamics. However, we may be unable to achieve some or all of these benefits in the time we expect, if at all, for a variety of reasons, including: compliance with the requirements of being an independent, publicly traded company require significant amounts of our management’s time and effort, which may divert management’s attention from operating and growing our business; we may be more susceptible to market fluctuations, actions by activist stockholders and other adverse events than if we were still a part of DuPont; our businesses are less diversified than DuPont’s businesses prior to the Spin-Off; we may not enjoy the same benefit of leverage and market reputation that we enjoyed as part of DuPont; we are more exposed to matters such as foreign currency exchange rates as a smaller, stand-alone company than we had been as a part of the larger DuPont enterprise; under the terms of the Tax Matters Agreement (the "Tax Matters Agreement") with DuPont, we are restricted from taking certain actions that could cause the distribution to fail to qualify as a tax-free transaction and these restrictions may limit us for a period of time from pursuing strategic transactions and equity issuances or engaging in other transactions that may increase the value of our business; and under the terms of the Corteva Letter Agreement and the Legacy Liabilities Assignment Agreement (as defined herein), we are restricted in our ability to transfer to third parties or separate our businesses and assets without assigning certain Legacy Liabilities (as defined in the Corteva Letter Agreement) contractually allocated to us in connection with the Spin-Off to such separated businesses and assets or transferees or meeting certain other alternative conditions. If we fail to achieve some or all of the benefits that we expect to achieve as an independent company, or do not achieve them in the time we expect, our business, financial condition, cash flows and results of operations could be materially and adversely affected.
23
We could incur substantial additional costs and experience temporary business interruptions, and we may not be adequately prepared to meet the requirements of an independent, publicly traded company on a timely or cost-effective basis.
We have historically operated as part of DuPont, and DuPont has provided us with various corporate functions. DuPont does not provide us with assistance other than the transition and other services described in the Transition Services Agreements. These services do not include every service that we have received from DuPont in the past, and DuPont is only obligated to provide the transition services for limited periods following completion of the Spin-Off. Following the cessation of the Transition Services Agreements, we will need to provide internally or obtain from unaffiliated third parties the services we will no longer receive from DuPont. We may be unable to replace these services in a timely manner or on terms and conditions as favorable as those we receive from DuPont.
In connection with the Spin-Off, we have been installing and implementing information technology infrastructure to support certain of our business functions, including accounting and financial reporting, research and development, human resources, legal and compliance, insurance, communications and indirect sourcing. If we are unable to transition effectively, we may incur temporary interruptions in business operations. Any delay in implementing, or operational interruptions suffered while implementing, our new information technology infrastructure could disrupt our business and have a material adverse effect on our results of operations.
In addition, in connection with the Spin-Off, we are now subject to reporting and other obligations under the Exchange Act. The Exchange Act requires that we file annual, quarterly and current reports with respect to our business and financial condition. Beginning with our second required Annual Report on Form 10-K, we will be required to comply with Section 404 of the Sarbanes Oxley Act of 2002, as amended (the “Sarbanes Oxley Act”), which will require annual management assessments of the effectiveness of our internal control over financial reporting and a report by our independent registered public accounting firm on the effectiveness of internal control over financial reporting. Under the Sarbanes Oxley Act, we are also required to maintain effective disclosure controls and procedures. To comply with these requirements, we may need to upgrade our systems, implement additional financial and management controls, reporting systems and procedures and hire additional accounting and finance staff. These reporting and other obligations may place large demands on management, administrative and operational resources, including accounting systems and resources. If we are unable to upgrade our financial and management controls, reporting systems, information technology systems and procedures in a timely and effective fashion, our ability to comply with financial reporting requirements and other rules that apply to reporting companies under the Exchange Act could be impaired, and we may be unable to conclude that our internal control over financial reporting is effective. If we are not able to comply with the requirements of Section 404 of the Sarbanes Oxley Act in a timely manner, or if we or our independent registered public accounting firm identify deficiencies in our internal control over financial reporting that are deemed to be material weaknesses, the market price of shares of our common stock could decline and we could be subject to sanctions or investigations by the SEC or other regulatory authorities, which would require additional financial and management resources.
We have incurred indebtedness in connection with the Spin-Off
In connection with the Spin-Off, we incurred indebtedness in an aggregate principal amount of $4.1 billion, consisting of the $2.35 billion Senior Secured Term Loan Facility, which was entered into on October 31, 2025, and the $1.0 billion of Senior Secured Notes due 2032 and $750 million of Senior Unsecured Notes due 2033, which were issued on August 15, 2025. We also entered into the Senior Secured Revolving Facility of $1.25 billion on October 31, 2025. We may also add incremental term loan facilities, increase commitments under the revolving credit facility or otherwise incur additional indebtedness in the future. Such debt obligations could potentially have important consequences to us and our debt and equity investors, including:
•requiring a substantial portion of our cash flow from operations to make interest payments;
•making it more difficult to satisfy debt service and other obligations;
•reducing the amount of borrowings that may be obtained through offering certain of our assets as security;
•increasing the risk of a future credit ratings downgrade of our debt, which could increase future debt costs and limit the future availability of debt financing;
•increasing our vulnerability to general adverse economic and industry conditions;
•reducing the cash flow available to fund capital expenditures and other corporate purposes and to grow our business;
•limiting our flexibility in planning for, or reacting to, changes in our business and our industry;
•placing us at a competitive disadvantage relative to our competitors that may not be as highly leveraged with debt;
•requiring us to repatriate earnings to the United States, causing withholding taxes to be applied, which in turn could increase our effective tax rate; and
•limiting our ability to borrow additional funds as needed or take advantage of business opportunities as they arise, pursue our business strategies, pay cash dividends or repurchase common stock.
24
To the extent that we incur additional indebtedness, the foregoing risks could increase. In addition, our actual cash requirements in the future may be greater than expected. Our cash flow from operations may not be sufficient to repay all of the outstanding debt as it becomes due, and we may not be able to borrow money, sell assets or otherwise raise funds on acceptable terms, or at all, to refinance our debt.
We may have received better terms from unaffiliated third parties than the terms received in the commercial agreements we and/or certain of our subsidiaries will enter into with DuPont and/or certain of its subsidiaries.
In connection with the Spin-Off, we and/or certain of our subsidiaries have entered into various other agreements with DuPont and/or certain of its subsidiaries, including, but not limited to, the Tax Matters Agreement, the Employee Matters Agreement, the Transition Services Agreements, the Intellectual Property Cross-License Agreement, the Transitional House Marks Trademark License Agreement, the ESL Cost Sharing Agreement and certain other intellectual property-related, real estate-related, confidentiality-related, regulatory-related and commercial agreements, which govern certain relationships between us and DuPont that were previously provided within DuPont. Such agreements were intended to be entered into on arm’s-length terms similar to those that would be agreed with an unaffiliated third party such as a buyer in a sale transaction, but we did not have an independent board of directors or a management team independent of DuPont representing our interests while such agreements were being negotiated. In addition, until the Spin-Off was completed, we continued to be a wholly owned subsidiary of DuPont and, accordingly, DuPont still had the sole discretion to determine and change the terms of the separation through the distribution date. As a result of these factors, some of the terms of such agreements may not reflect terms that would have resulted from arm’s-length negotiations among unaffiliated third parties, and it is possible that we might have been able to achieve more favorable terms if the circumstances differed.
If the Spin-Off were to fail to qualify for non-recognition treatment for U.S. federal income tax purposes, DuPont could be subject to significant tax liabilities, and our indemnification obligations to DuPont related to such taxes could adversely affect our business, financial condition, and results of operations.
DuPont received a written opinion (the "Tax Opinion") from Skadden, Arps, Slate, Meagher & Flom LLP to the effect that, among other things, DuPont's distribution of our stock, together with certain related transactions, will qualify as a tax-free transaction for U.S. federal income tax purposes under the Internal Revenue Code of 1986, as amended (the "Code"). The Tax Opinion relies on certain facts, assumptions and undertakings, and certain representations from DuPont and us, regarding the past and future conduct of both respective businesses and other matters. Notwithstanding the Tax Opinion, the Internal Revenue Service (“IRS”) could determine on audit that the distribution and/or certain related transactions should be treated as a taxable transaction if it determines that any of these facts, assumptions, representations or undertakings are not correct or have been violated, or that the distribution should be taxable for other reasons, including if the IRS were to disagree with the conclusions of the Tax Opinion.
Generally, taxes resulting from the failure of the Spin-Off to qualify for non-recognition treatment for U.S. federal income tax purposes would be imposed on DuPont or DuPont stockholders who received shares of Qnity common stock in the Spin-Off. Under the Tax Matters Agreement that we entered into with DuPont, we are generally obligated to indemnify DuPont against some or all of such taxes imposed on DuPont in certain circumstances. Such indemnifiable taxes could be significant. To the extent that we are responsible for any liability under the Tax Matters Agreement, there could be a material adverse impact on our business, financial condition, results of operations and cash flows in future reporting periods.
Even if the distribution otherwise constitutes a tax-free transaction to stockholders under Section 355 of the Code, DuPont may be required to recognize corporate-level tax on the distribution and certain related transactions under Section 355(e) of the Code if, as a result of transactions considered part of a plan with the distribution, there is a 50% or greater change of ownership in DuPont or us. If DuPont is required to recognize corporate-level tax on the distribution and/or certain related transactions under Section 355(e) of the Code, then under the Tax Matters Agreement, we may be required to indemnify DuPont for all or a portion of such taxes, which could be a significant amount, if such taxes were the result of either direct or indirect transfers of Qnity common stock or certain reasons relating to the overall structure of the distribution.
We agreed to numerous restrictions to preserve the tax-free treatment of the Spin-Off, which may reduce our strategic and operating flexibility.
Our ability to engage in certain transactions could be limited or restricted after the distribution to preserve, for U.S. federal income tax purposes, the tax-free nature of the distribution and certain related transactions. These covenants include certain restrictions on our activity for a period of two years following the Spin-Off, including on our ability to enter into acquisition, merger, liquidation, sale and stock redemption and certain other transactions with respect to our stock or assets. In addition, under the Tax Matters Agreement, we may be required to indemnify DuPont against any such tax liabilities as a result of the acquisition of our stock or assets, even if we do not participate in or otherwise facilitate the acquisition. Furthermore, we are subject to specific restrictions on discontinuing the active conduct of our trade or business, the issuance or sale of stock or other securities, and sales of assets outside the ordinary course of business.
25
These covenants and indemnification obligations may significantly limit our ability to pursue certain transactions that we may believe to otherwise be in the best interests of our stockholders or that might increase the value of our business, and might discourage or delay a strategic transaction that our stockholders may consider favorable.
In connection with the Spin-Off, we have been contractually allocated, and directly pay or indemnify DuPont for, certain liabilities, including certain PFAS liabilities. If we are required to make payments pursuant to these indemnification obligations, we may need to divert cash to meet those obligations and our business, financial condition, and results of operations and cash flows could be negatively impacted. In addition, DuPont will indemnify us for certain liabilities. These indemnification obligations may not be sufficient to insure us against the full amount of liabilities we incur, and DuPont may not be able to satisfy its indemnification obligations in the future.
Pursuant to the Separation and Distribution Agreement, the Employee Matters Agreement and the Tax Matters Agreement with DuPont, we have been contractually allocated, and directly pay or indemnify DuPont for, certain liabilities (including those contractually allocated between DuPont and Qnity based on the Applicable Percentages as defined in the Separation and Distribution Agreement) for uncapped amounts, which may include, among other items, historical tax obligations, associated defense costs, settlement amounts and judgments. Payments pursuant to these indemnification obligations, including those in respect of certain legacy and other liabilities (including Legacy Liabilities (as defined in the Corteva Letter Agreement), any funding obligations of DuPont under the Memorandum of Understanding, legacy PFAS liabilities and liabilities related to businesses and operations of DuPont that were previously discontinued or divested), may be significant and could negatively impact our business, particularly indemnification obligations relating to our actions that could impact the tax-free nature of the distribution. Furthermore, with respect to such liabilities contractually allocated between DuPont and Qnity based on the Applicable Percentages, Qnity has irrevocably granted to DuPont, coupled with an interest, sole and exclusive authority to, among other things, commence, notice, prosecute, manage, control, conduct, administer, handle, manage, defend (or assume the defense of), litigate, arbitrate, mediate, settle, resolve, dispose of, cover or otherwise determine all matters with respect to any claims related to, arising out of or resulting from any such liabilities. DuPont may also, in its sole discretion, require Qnity to remit any amounts owed in respect of Qnity’s share of such liabilities directly to the relevant third-party owed such amount. DuPont’s exercise of this authority could result in an increase in the financial burden of such liabilities borne by us, and such increase could be material to our business, financial condition and results of operations and cash flows.
Third parties could also seek to hold us responsible for any of the liabilities contractually allocated to DuPont, including those related to DuPont’s Industrials business and DuPont’s share of those contractually allocated between DuPont and Qnity based on their respective Applicable Percentage (including Legacy Liabilities (as defined in the Corteva Letter Agreement), any funding obligations of DuPont under the Memorandum of Understanding, legacy PFAS liabilities and liabilities related to businesses and operations of DuPont that were previously discontinued or divested). DuPont will agree to indemnify us for such applicable liabilities, but such indemnification may not be sufficient to protect us against the full amount of such liabilities or our Applicable Percentage thereof, as applicable. In addition, DuPont may not be able to fully satisfy its indemnification obligations with respect to the liabilities we incur that have been contractually allocated to DuPont. Even if we ultimately succeed in recovering from DuPont any amounts for which we are held liable, we may be temporarily required to bear these losses ourselves. Each of these risks could negatively affect our business, financial condition, results of operations and cash flows.
Although we have not identified any conflicts of interest, certain of our directors and employees may have actual or potential conflicts of interest because of their financial or equity interests in DuPont, or because of their previous positions with DuPont.
Because of their former positions with DuPont, certain of our executive officers and directors own equity interests in both us and DuPont. Continuing ownership of DuPont shares and equity awards could create, or appear to create, potential conflicts of interest if we and DuPont face decisions that could have implications for both us and DuPont. For example, our officers and directors could be motivated or seen to be motivated to make decisions benefiting DuPont that would not have been made if they had no ownership of DuPont shares or equity awards, which may in turn cause harm to our reputation. We have not currently identified any conflicts of interest; however, potential conflicts of interest could arise in connection with the resolution of any dispute between us and DuPont regarding the terms of the agreements governing the Spin-Off and our relationship with DuPont. Potential conflicts of interest may also arise out of any commercial arrangements that we or DuPont, and/or our respective affiliates, may enter into in the future. For example, due to the existing relationships between our officers and directors who have historically been employed by DuPont, our officers and directors may make or be seen to be making decisions benefiting DuPont that would not have been made if we had no such officers or directors. A dispute regarding a potential or actual conflict of interest involving us and DuPont could negatively impact our businesses, results of operations, cash flows and financial condition. In addition, public perception of such an actual or apparent conflict of interest could pose reputational risks and expose us to increased scrutiny from investors and regulators.
26
We are subject to certain restrictions in the Corteva Side Letter, which may restrict our ability to pursue our business strategies.
In connection with their separation, DuPont entered into a letter agreement with Corteva (the “Corteva Letter Agreement”) that imposes limitations intended to preserve the agreed allocation of certain legacy liabilities among the parties following the separation. In accordance with the terms and conditions of the Corteva Letter Agreement, in addition to the Separation and Distribution Agreement, we entered into the Legacy Liabilities Assignment Agreement pursuant to which, among other things, we are bound by, and subject to, on a partially assigned basis, certain terms and conditions of the Corteva Letter Agreement, including the same limitations on our ability to transfer to third parties or separate our businesses and assets without assigning certain Legacy Liabilities (as defined in the Corteva Letter Agreement) contractually allocated to us in connection with the Spin-Off to such separated businesses and assets or transferees or meeting certain other alternative conditions, except that the value of the Minimum EBITDA is equal to $1,100,000,000.
Restrictions under our Intellectual Property Cross-License Agreement with DuPont will limit our ability to prosecute, maintain and enforce certain intellectual property.
We are dependent to a certain extent on DuPont to prosecute, maintain, defend and enforce certain of the intellectual property licensed under our Intellectual Property Cross-License Agreement with DuPont. For example, DuPont has the sole right to file, prosecute maintain and defend the patents, including patents filed on trade secrets and other know-how, licensed to us. DuPont also has the sole right to enforce the intellectual property, including patents, trade secrets and other know-how, licensed to us. If DuPont chooses to not enforce the intellectual property licensed to us under the Intellectual Property Cross-License Agreement, we may not be able to prevent competitors from making, using and selling competitive products and services.
Risks Related to our Capital Stock
We cannot be certain that an active trading market for our common stock will be sustained and our stock price may fluctuate significantly.
Qnity became an independent, publicly traded company, and Qnity common stock commenced trading on the New York Stock Exchange under the symbol "Q" at the start of trading on November 3, 2025. We cannot guarantee that an active trading market will be sustained for our common stock. If an active trading market is not sustained, our stockholders may have difficulty selling their shares of our common stock at an attractive price, or at all.
The trading price of our common stock is determined in the public markets and may be influenced by many factors that may cause the price to fluctuate significantly, some of which may be beyond our control, including:
•our quarterly or annual earnings, or those of other companies in our industry;
•the failure of securities analysts to continue to cover our common stock;
•actual or anticipated fluctuations in our operating results;
•changes in earnings estimates by securities analysts or our ability to meet those estimates or our earnings guidance;
•the operating and stock price performance of other comparable companies;
•overall market fluctuations and domestic and worldwide economic conditions; and
•other factors described in this “Risk Factors” section and elsewhere in this Annual Report on Form 10-K.
Stock markets in general have experienced volatility that has often been unrelated to the operating performance of a particular company. These broad market fluctuations may adversely affect the trading price of our common stock.
A large number of shares of our common stock are or will be eligible for future sale, which may cause our stock price to decline.
Upon completion of the distribution, there was an aggregate of approximately 209,443,730 million shares of our common stock issued and outstanding, giving effect to a distribution ratio of one share of our common stock for every two shares of DuPont common stock. These shares are freely tradable without restriction or further registration under the U.S. Securities Act of 1933, as amended (the “Securities Act”), unless the shares are owned by one of our “affiliates”, as that term is defined in Rule 405 under the Securities Act.
Any sales of a substantial number of shares of our common stock in the public market or the perception that such sales might occur, in connection with the distribution or otherwise, may cause the market price of our common stock to decline. We are unable to predict whether large amounts of our common stock will be sold in the open market. In addition, a portion of DuPont common stock was held by index funds tied to stock indices prior to the distribution. If we were included in these indices at the time of the distribution, these index funds may be required to sell our common stock they receive in the distribution.
27
Our stockholders’ percentage of ownership in Qnity may be diluted in the future.
Our stockholders’ percentage ownership in Qnity may be diluted in the future because of equity issuances of our common stock for acquisitions, capital market transactions or otherwise, including, without limitation, outstanding equity awards resulting from the treatment of DuPont equity awards in connection with the distribution and equity awards that we may grant to our directors, officers and employees in the future. Such issuances may have a dilutive effect on our earnings per share, which could adversely affect the market price of our common stock.
In addition, our amended and restated certificate of incorporation will authorize us to issue, without the approval of our stockholders, one or more classes or series of preferred stock having such designation, preferences and relative, participating, optional and other special rights, including preferences over our common stock with respect to dividends and distributions, as our board of directors generally may determine. The terms of one or more classes or series of preferred stock could dilute the voting power or reduce the value of our common stock. For example, we could grant holders of Qnity preferred stock the right to elect some number of our directors in all events or on the happening of specified events or to veto specified transactions. Similarly, the repurchase or redemption rights or liquidation preferences we could assign to holders of Qnity preferred stock could affect the residual value of our common stock.
Our Series A Preferred Stock has separate voting rights over certain potentially material matters and transactions, and the Trust is required to vote against such matters and transactions.
In addition to our common stock, we have Series A Preferred Stock, all issued and outstanding shares of which are held by a noncharitable purpose trust (the "Trust") established for the purpose of enforcing the rights of the Series A Preferred Stock under the Certificate of Designation and our amended and restated certificate of incorporation.
Under our amended and restated certificate of incorporation, without the prior affirmative and unanimous vote of the holders of all of the outstanding shares of Series A Preferred Stock, we are not be permitted to, among other things, (i) amend, alter, change, modify, supplement, repeal or adopt any provision inconsistent with, directly or indirectly (including, without limitation, through any Corporate Event (as defined therein)), (a) any provisions of our amended and restated certificate of incorporation or our amended and restated bylaws that expressly limit our corporate purpose and the authority of our board of directors such that, as a matter of Delaware corporate law, we and our board of directors will not be able to take any action, directly or indirectly, to challenge, breach, question, dispute, undermine, diminish, revoke, circumvent, impair, negate, supersede, prohibit, restrict, hinder, prevent, interfere with or otherwise contravene DuPont’s sole and exclusive authority to determine the matters described in the first paragraph of the section entitled “—We are subject to risks associated with certain of our indemnification obligations under the Separation and Distribution Agreement, pursuant to which we may be required to make substantial cash payments to DuPont or the applicable third party for matters solely and exclusively controlled by DuPont”, or in a manner that would circumvent, revoke, impair, negate, supersede, prohibit, restrict, diminish, hinder, prevent, interfere with or otherwise adversely affect any of the powers, designations, preferences, privileges, protections or rights of the holders of the Series A Preferred Stock, or (b) any provision of the Certificate of Designation, or (ii) take, or attempt to take, any action, enter into any agreement, or consummate any transaction (including, without limitation, any financing transaction or Corporate Event) that would result in the Series A Preferred Stock no longer being outstanding or being held (either beneficially or of record) by any person other than the Trust, or that would otherwise circumvent, revoke, impair, negate, supersede, prohibit, restrict, diminish, hinder, prevent, interfere with or otherwise adversely affect any of the powers, designations, preferences, privileges, protections or rights of the Series A Preferred Stock. Additionally, as all shares of the Series A Preferred Stock are held by the Trust, and the Trust is prohibited under the terms of its trust documents from voting in favor of any such actions, we expect and intend that the aforementioned limitations on our corporate purpose and the authority of our board of directors is perpetual.
Such separate voting rights by our Series A Preferred Stock may discourage or prevent third parties from initiating or entering into transactions with Qnity, or Qnity from entering into transactions, that would otherwise be attractive to Qnity or its common stockholders.
28
Certain provisions in our amended and restated certificate of incorporation and amended and restated bylaws, Delaware law and in the Tax Matters Agreement and other Spin-Off-related agreements may prevent or delay an acquisition of us, which could decrease the trading price of our common stock.
Provisions of the Delaware General Corporation Law could discourage potential acquisition proposals and could delay, deter or prevent a change in control. Section 203 of the Delaware General Corporation Law, to which we are subject, imposes various impediments to the ability of a third-party to acquire control of us, even if a change in control would be beneficial to our existing stockholders. Additionally, provisions of our amended and restated certificate of incorporation and amended and restated bylaws could deter, delay or prevent a third-party from acquiring us, even if doing so would benefit our stockholders, including without limitation, the authority of the board of directors to issue, without stockholder approval, preferred stock with such terms as the board of directors may determine. These provisions may also prevent or discourage attempts to remove and replace incumbent directors.
Several of the agreements that we and/or certain of our subsidiaries entered into with DuPont and/or certain of its subsidiaries in connection with the Spin-Off require DuPont’s consent to any assignment of our rights and obligations, or a change of control of us, under the agreements. These consent rights may discourage, delay or prevent a change of control or similar transaction that you may consider favorable.
In addition, indemnity obligations and/or certain restrictive covenants in the Tax Matters Agreement might discourage, delay or prevent a change of control that you may consider favorable.
The exclusive forum provisions in our amended and restated bylaws could limit our stockholders’ ability to obtain a favorable judicial forum for disputes with us or any of our directors, officers or employees, or our stockholders, or the underwriters of any offering giving rise to such claim, which may discourage lawsuits with respect to such claims.
Our amended and restated bylaws provide that unless we consent in writing to the selection of an alternative forum, the Court of Chancery of the State of Delaware will be the sole and exclusive forum for any derivative action or proceeding brought on behalf of us, any action asserting a claim of breach of a fiduciary duty owed by any of our directors, officers, other employees, stockholders or agents to us or our stockholders, any action asserting a claim arising pursuant to any provision of the DGCL, our amended and restated certificate of incorporation or our amended and restated bylaws, or any action asserting a claim governed by the internal affairs doctrine. Notwithstanding the foregoing, unless we consent in writing to the selection of an alternative forum, the federal district courts of the United States of America will be the sole and exclusive forum for the resolution of any complaint asserting a cause of action arising under the Securities Act or any rules or regulations promulgated thereunder. The choice of forum provision may limit a stockholder’s ability to bring a claim in a judicial forum that it finds favorable for disputes with us or our directors, officers, other employees, stockholders or agents, which may discourage such lawsuits against us or our directors, officers other employees, stockholders or agents. Our stockholders will not be deemed to have waived our compliance with the federal securities laws and the rules and regulations thereunder as a result of our exclusive forum provisions. These exclusive forum provisions will not apply to any action brought to enforce a duty or liability created by the Exchange Act or any rules or regulations promulgated thereunder. If a court were to find the choice of forum provision contained in our amended and restated bylaws to be inapplicable or unenforceable in an action, we may incur additional costs associated with resolving such action in other jurisdictions.
ITEM 1B. UNRESOLVED STAFF COMMENTS.
None.
29
ITEM 1C. CYBERSECURITY.
Risk Management and Strategy
We engage managed security service providers and independent experts for penetration testing, vulnerability assessments, and program reviews. These engagements supplement internal resources and help our cybersecurity posture to remain current. In addition, in connection with our Separation, we entered into Transition Services Agreements, pursuant to which DuPont will continue to provide certain information technology, administrative and other services on a transitional basis.
Governance
Cybersecurity oversight resides with our Board’s Audit Committee, which receives periodic reports from senior leadership. Cybersecurity updates are also provided to the full Board as needed. The CISO reports to the Chief Information Officer (CIO). Updates include information related to threat trends, incident metrics, and third-party risk management activities. Our Board periodically reviews its composition to ensure appropriate cybersecurity expertise.
Incident Response and Monitoring
Our cybersecurity risk assessment and management processes are implemented and maintained by certain members of our management team, including our CISO and our CIO. Our CISO has over twenty years of experience in information security leadership, including serving as CISO of two other multinational companies, holds master’s degrees in computer science and mechanical engineering, and is CISSP certified. Our CIO has over five years of experience in senior executive roles that involve oversight of cybersecurity matters and holds a master’s degree in information and knowledge strategy.
We maintain a formal Cybersecurity Incident Response Plan that classifies incidents into severity levels and defines escalation paths. Material incidents trigger immediate notification to senior management and the Board . Supported by internal teams and external partners, our 24/7 monitoring supports timely detection and response. Post-incident reviews drive continuous improvement.
Employee Training
All employees are required to complete mandatory annual cybersecurity training covering phishing awareness, data protection, mobile security, and insider threat prevention. We also conduct periodic phishing simulations and targeted refreshers for high-risk roles.
Risks from Cybersecurity Threats
30
ITEM 2. PROPERTIES
Qnity is headquartered in Wilmington, Delaware. We have a global footprint with a total of approximately 100 manufacturing facilities, laboratory, service centers, warehouses and office facilities, many of which serve more than one purpose and both of our segments. Our facilities are located in 20 different countries representing all four of our global regions; with just over half of the facilities located in the Asia Pacific region, about one-third located in the U.S. and Canada and the rest located in EMEA and Latin America. Approximately 20 of our facilities are dedicated to our Semiconductor Technologies segment and approximately 30 of our facilities are dedicated to our Interconnect Solutions segment, with the remainder being shared between the two segments. Among our 39 manufacturing sites, five manufacturing sites are operated by our joint ventures. We own approximately 20% of our facilities, while the remaining facilities are leased from third parties, including DuPont. Additional information with respect to the Company's property, plant and equipment and leases is contained in Notes 11, 16 and 22 to the Consolidated Financial Statements.
The Company has investments in property, plant and equipment related to global manufacturing operations. The number of manufacturing sites at December 31, 2025 is as follows:
| Geographic Region | Semiconductor Technologies | Interconnect Solutions | Total 1 | ||||||||
| Asia Pacific | 10 | 12 | 22 | ||||||||
EMEA 2 | — | 2 | 2 | ||||||||
Americas3 | 8 | 11 | 19 | ||||||||
| Total | 18 | 25 | 43 | ||||||||
1. Four sites are used by multiple segments and are included more than once in the figures above.
2. Europe, Middle East, and Africa.
3. Includes United States, Canada and Latin America
The Company's principal sites include facilities which, in the opinion of management, are suitable and adequate for their use and have sufficient capacity, or plans to increase capacity, which meet the Company's current needs and expected near-term growth. No title examination of the properties has been made for the purpose of this report and certain properties are shared with other tenants under long-term leases.
ITEM 3. LEGAL PROCEEDINGS
In the normal course of business, the Company and its subsidiaries are subject to various litigation matters, including, but not limited to, patent infringement claims, employment claims, including alleged wage and hour violations, and commercial claims. It is the opinion of the Company’s management that the possibility is remote that the aggregate of all such claims and lawsuits will have a material adverse impact on the results of operations, financial condition and cash flows of the Company.
ITEM 4. MINE SAFETY DISCLOSURES
Not applicable
31
| Qnity Electronics, Inc. | ||||||||
| PART II | ||||||||
ITEM 5. MARKET FOR REGISTRANT'S COMMON EQUITY, RELATED STOCKHOLDER MATTERS AND ISSUER PURCHASES OF EQUITY SECURITIES
The Company’s common stock is listed on the New York Stock Exchange under the trading symbol “Q.” At February 24, 2026, there were 54,849 stockholders of record of the Company’s common stock. This is not the actual number of beneficial owners of the Company’s common stock as some shares are held in “street name” by brokers and others on behalf of individual owners.
Stock Performance Graph
The graph below compares the cumulative total return of holders of our common stock with the cumulative total return of the Standard & Poor’s 500 Stock Index (S&P 500) and the Standard & Poor’s 1500 Semiconductors & Semiconductor Equipment Stock Index.
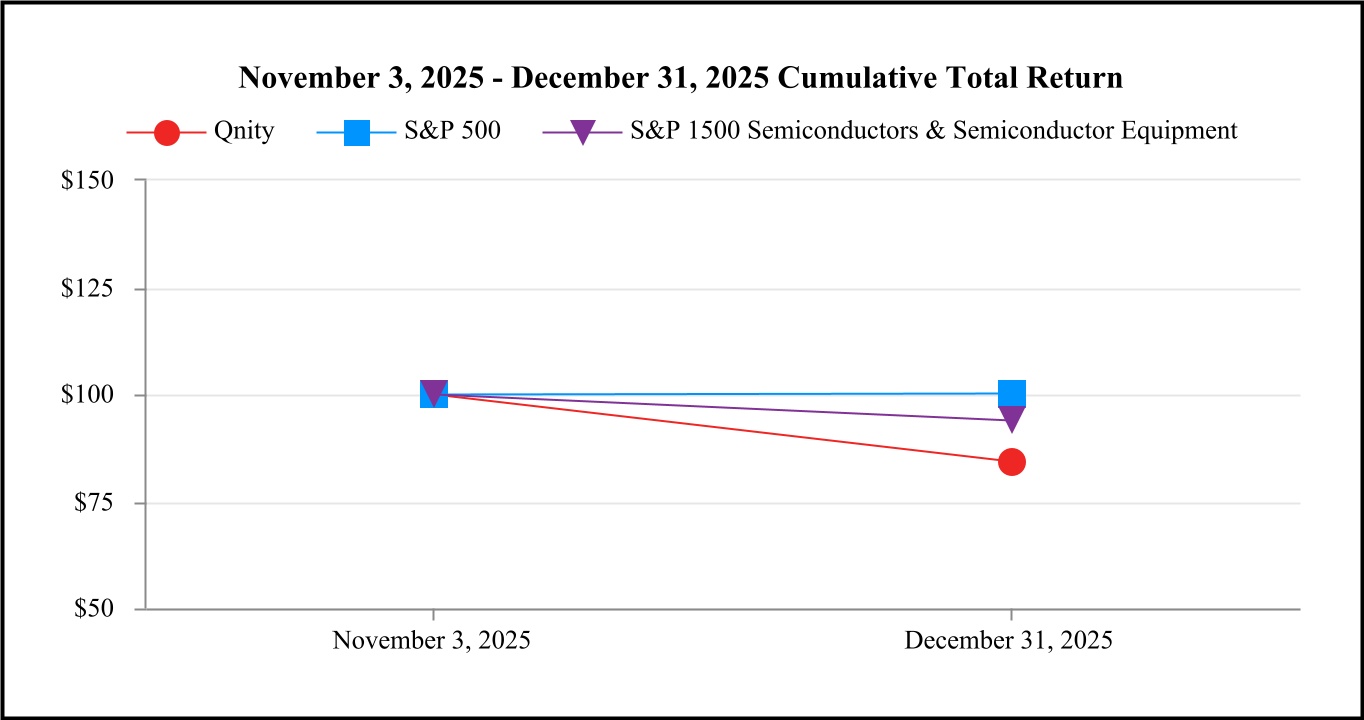
The period shown in the above graph is based on the assumption that $100 had been invested in Qnity common stock, the S&P 500 and the Standard & Poor’s 1500 Semiconductors & Semiconductor Equipment Stock Index on November 3, 2025, and that all quarterly dividends were reinvested. On November 3, 2025, the Company began trading as an independent, publicly traded company under the stock symbol “Q” on the New York Stock Exchange. The cumulative dollar returns shown on the graph represent the value that such investments would have had on the date indicated.
Dividends
For information regarding dividends paid to stockholders in 2025 and the declaration and payment of future dividends, see Part II., Item 7. “Management’s Discussion and Analysis of Financial Condition and Results of Operations—Liquidity and Capital Resources—Cash Flows—Dividends.”
Unregistered Sales of Equity Securities and Use of Proceeds
Not applicable.
ITEM 6. RESERVED
Not applicable.
32
ITEM 7. MANAGEMENT'S DISCUSSION AND ANALYSIS OF FINANCIAL CONDITION AND RESULTS OF OPERATIONS
The following discussion and analysis provides information that management believes is relevant to an assessment and understanding of Qnity’s financial condition and results of operations. Management’s discussion and analysis of financial condition and results of operations is provided as a supplement to, and should be read in conjunction with, the Consolidated Financial Statements and related notes to enhance the understanding of the Company’s operations and present business environment. This discussion and analysis contains forward-looking statements and involves numerous risks and uncertainties, including, but not limited to, those discussed in this “Management’s Discussion and Analysis of Financial Condition and Results of Operations” and “Risk Factors” in this Annual Report. Carefully read the information under “Cautionary Note Regarding Forward-Looking Statements” in this Annual Report. Qnity assumes no obligation to update any of these forward-looking statements except as required by law. Actual results may differ materially from those contained in any forward-looking statements.
BUSINESS OVERVIEW
We are one of the largest global leaders in materials and solutions for the semiconductor and electronics industries. We empower our customers’ technology roadmaps to enable advancements in megatrends such as AI, high-performance computing and advanced connectivity. We partner with leading semiconductor and advanced device manufacturers to address complex challenges and develop solutions that facilitate next-generation technological innovations. With over 50 years of experience in systems engineering and material science, a global manufacturing footprint, and major application labs across the world, we are well-positioned to capitalize on emerging opportunities across various sectors including data centers, communications infrastructure, industrials, automotive, and consumer electronics.
We are organized into two operating segments:
•Semiconductor Technologies: Our Semiconductor Technologies segment provides a portfolio of innovative materials and solutions utilized across multiple stages of the semiconductor manufacturing process. These advanced materials are qualified into customers’ roadmaps, designed to improve chip performance, enhance yield and enable leading-edge node technology.
•Interconnect Solutions: Our Interconnect Solutions segment offers what we believe to be a comprehensive range of best-in-class material solutions that address the evolving complexities of signal integrity, thermal and power management and advanced packaging. These solutions are integral for advanced electronics hardware, including complex printed circuit boards and advanced semiconductor packaging.
Our broad portfolio of solutions and materials across both Semiconductor Technologies and Interconnect Solutions segments positions us as a comprehensive solutions provider for our customers. We are often the partner of choice due to our strong innovation capabilities and extensive materials and engineering expertise. In a fast-paced electronics industry, our customers’ needs are highly performance-driven and our long-standing relationships and strong renewal rates demonstrate our commitment to delivering excellence in a demanding market.
MACROECONOMIC ENVIRONMENT
Recent and continuing developments in U.S. and foreign policy related to trade, such as the imposition of new or increased tariffs on product imports from certain countries have heightened global trade tensions and sparked significant uncertainty in macroeconomic and geopolitical environments, particularly with respect to China. The nature of our global business exposes us to risks associated with trade conflicts between the U.S. and its trading partners, including about the ultimate extent and duration of the tariffs, responsive actions from other countries and the resulting impacts, including on general economic conditions and on our financial condition, liquidity, or results of operations. As a result, we may face a reduction in the demand for, and in the competitiveness of, our products, particularly from local or domestically sourced competition, harm to our relationships with our customers, and decreased profitability, which have the potential to adversely affect our business, financial condition and results of operations. While we have meaningful exposure to global trade dynamics, our local‑for‑local sourcing of raw materials limits exposure to tariff risk.
33
KEY FACTORS AFFECTING OUR BUSINESS
We believe that our performance and future success depend on a number of factors that present significant opportunities, but also pose risks and challenges. Our ability to take advantage of these opportunities is subject to various risks, including general economic, business and market dynamic risks, the impact of the Spin-Off and the debt we have incurred in connection with the Spin-Off. See the section entitled “Risk Factors” for a discussion of these risks, which you should consider carefully.
Market and Technology Drivers
Demand for our products is driven by advances in semiconductor technology, including AI‑enabled high-performance computing, advanced packaging and higher layer counts, which increase material intensity and pricing. These trends are discussed further in Item 1.
Supply chain, manufacturing capacity and customer inventories
Our ability to meet customer commitments relies on an uninterrupted flow of critical raw materials, global semiconductor and advanced electronics supply chain, and manufacturing capacity. Tight industry constraints, geopolitical events, global trade disruptions, or weather-related disruptions could constrain supply, increase costs, and lengthen lead times, potentially delaying production and pressuring margins. To bolster resilience, we leverage multi-sourcing strategies for raw materials, maintain long-term agreements with key customers, and periodically build strategic inventory when demand visibility warrants.
Customer inventory practices can further influence our short-term performance. In periods of tight supply, customers may build buffer inventory, inflating near-term orders; conversely, destocking cycles can suppress demand even when underlying consumption remains healthy. We manage these dynamics through customer-based forecasting, disciplined allocation processes, and a measured pricing approach. Together, these actions help us navigate supply chain volatility while supporting reliable delivery and business continuity.
Supply chain disruptions and geopolitical concerns over the last several years highlight the critical need for resilient global supply networks. In response, governments worldwide are co-investing in semiconductor industries to ensure domestic supply, creating new opportunities for semiconductor companies including Qnity.
For a discussion of the risks associated with supply chain, manufacturing capacity and customer inventories, see “Supply chain and operational disruptions and volatility in energy and raw material costs could adversely impact our sales and earnings and impact access to sources of liquidity” and “Our reliance on certain key customers, contract manufacturers and suppliers could adversely affect our overall sales and profitability” in Part I, Item 1A. Risk Factors.
Design wins with new and existing customers
Our growth depends on our ability to secure design “wins”, which are instances when a customer validates one of our materials for use in a new node, package architecture, or end-product. Because the qualification cycle in semiconductors and advanced electronics can extend multiple quarters and often requires upfront expense, the timing, size, and scope are often difficult to predict. When we secure a win, we typically benefit from multi-year revenue streams tied to the life of that program.
Revenue conversion is neither immediate nor uniform; customers ramp new designs at different speeds, and capital spending priorities can shift with end-market conditions. As a result, the cadence at which design wins translate into volume orders can cause variability in our sales and working-capital needs. Maintaining our pace of wins therefore requires sustained research and development investment, close customer collaboration, and a disciplined project-selection process that focuses on high-value, extensible projects where our materials science leadership provides measurable differentiation.
For a discussion of the risks associated with our ability to anticipate and respond to customer requirements, see “If we are unable to anticipate and respond to rapid technological change and customer requirements by continuing to innovate and introduce new and enhanced products and solutions, we may experience a loss of market share, decreased sales, revenue, profitability and damage to our reputation” in Part I, Item 1A. Risk Factors.
Seasonality
Demand for several of our end-markets follows well-established seasonal patterns, with order activity typically accelerating in the second and third fiscal quarters as customers build inventory ahead of holiday production runs. This seasonality is most pronounced in our Interconnect Solutions segment, where historical sales peak during mid-year and moderate in the first and fourth quarters; although this seasonality pattern has decreased over the past few years and we expect this seasonality to further diminish going forward.
34
We mitigate these swings through flexible manufacturing planning, balanced geographic exposure, and disciplined inventory management. Nevertheless, mismatches between our production profile and customers’ seasonal demand can affect capacity utilization, gross margin, and working capital. Accordingly, we closely monitor sell-through data and downstream macro indicators to align procurement, staffing, and logistics with expected seasonal inflections.
For a discussion of the risks associated with fluctuations in demand for semiconductors, see ““Fluctuations in the demand for semiconductors and the overall volume of semiconductor manufacturing may decrease demand for our products and may adversely affect our business” in Part I, Item 1A. Risk Factors.
TRANSITION TO STAND-ALONE COMPANY
On May 22, 2024, DuPont de Nemours, Inc. (“DuPont” or “Parent”), of which we have historically been a part, announced its plan to separate its Electronics business, which included its semiconductor technologies and interconnect solutions businesses, from the other businesses of DuPont (the "Separation"). On November 1, 2025 (the "Separation and Distribution Date"), the Separation was completed through a tax-free pro rata distribution of all of the then issued and outstanding shares of our common stock to DuPont stockholders at a ratio of one share of our common stock for every two shares of DuPont’s common stock held at the close of business on the record date of October 22, 2025 (the "Distribution"). As a result of the Distribution, as of the Separation and Distribution Date, Qnity became an independent, publicly traded company, and Qnity common stock commenced trading on the New York Stock Exchange under the symbol "Q" at the start of trading on November 3, 2025.
Relationship with DuPont
Historically, we have relied on DuPont to manage certain aspects of our operations and provide us with certain services, the costs of which have historically been either allocated or directly billed to us. Historical costs for such services may not necessarily reflect the actual expenses we would have incurred, or will incur, as an independent company. In connection with the Separation, we and/or certain of our subsidiaries entered into the Separation and Distribution Agreement, by and between DuPont de Nemours, Inc. and Qnity Electronics, Inc., dated as of the Separation and Distribution Date (the “Separation and Distribution Agreement”) and certain other agreements with DuPont and/or certain of its subsidiaries as of the Separation and Distribution Date, including, but not limited to, the Tax Matters Agreement, the Employee Matters Agreement, the Transition Services Agreement (as defined below), the Ex-Station Lease ("ESL") Cost Sharing Agreement (as defined below) and other agreements governing aspects of the Company's relationship with DuPont following the Separation, including the Intellectual Property Cross-License Agreement and Legal Liabilities Assignment Agreement, among others. DuPont will not provide us with ongoing assistance other than the transition and other services described in these agreements. These services do not include every service that we have received from DuPont in the past, and DuPont is only obligated to provide the transition services for limited periods following the Separation. Following the cessation of the Transition Services Agreement, we will need to provide internally or obtain from unaffiliated third parties the services we will no longer receive from DuPont. The cost of replacing such services may vary from the historical costs directly allocated to us.
Stand-Alone Company Expenses
As a result of the Separation, we are required to operate as an independent company. Under the Transition Services Agreement with DuPont, dated as of the Separation and Distribution Date (the "Transition Services Agreement"), we are receiving certain services, including information technology services, from DuPont. As we transition from those services, we will incur additional expenditures. We currently estimate it will cost approximately $180 million in one-time costs, incurred over two years, to establish stand-alone information technology systems, not including the cost of maintenance or employee-related expenditures. In addition, we are incurring costs related to expanding, internally or through third parties, our functional capabilities such as information technology, finance, human resources, legal, tax, facilities, branding, government relations and insurance. We are subject to the requirements of the federal and state securities laws and stock exchange requirements and have established, or are in the process of establishing, additional procedures and practices as a stand-alone public company. As a result, we will incur incremental costs including, but not limited to, costs relating to external reporting, internal audit, treasury, investor relations, board of directors and officers and stock administration.
35
Cost Sharing Arrangements
Under the ESL Cost Sharing Agreement, dated as of August 28, 2025, by and between FCC Acquisition Corporation, a Delaware corporation and DuPont subsidiary, and DuPont Electronics, Inc., a Delaware corporation and Qnity subsidiary (the “ESL Cost Sharing Agreement’), DuPont and Qnity will be responsible for 60% and 40%, respectively, of certain costs and expenses that exceed the net revenues received by DuPont from certain third parties at the Experimental Station facility ("Experimental Station"). As a result, we may have to pay certain additional costs, including in the event that certain portions of Experimental Station not occupied by us, DuPont or their respective subsidiaries as of the Separation become vacant and DuPont does not lease such portions to a new tenant for rental rates that are at least equal to the current rental rates. Because DuPont will operate Experimental Station following the Separation, such costs will be beyond our control, and our obligation to bear such costs may negatively impact our business, results of operations, financial condition and cash flows.
Certain Indemnification Obligations to DuPont
In connection with the Separation, we have been contractually allocated, and directly pay or indemnify DuPont for, the Applicable Qnity Percentage of certain liabilities, including funding obligations of DuPont under the Memorandum of Understanding ("MOU"), legacy PFAS liabilities and liabilities related to businesses and operations of DuPont that were previously discontinued or divested. The Applicable Qnity Percentage is equal to the trailing twelve month Pro Forma Operating EBITDA attributable to the Qnity business and assets (measured at the time of the distribution, but prior to giving effect to the distribution) divided by the trailing twelve month Pro Forma Operating EBITDA (measured at the time of the distribution, but prior to giving effect to the distribution) of DuPont, multiplied by 100. On December 2, 2025, we and DuPont determined and agreed, pursuant to the Separation and Distribution Agreement, that the Applicable Qnity Percentage is 44%. Indemnification liabilities have been determined and recorded based on this Applicable Qnity Percentage and in accordance with the applicable provisions in the Separation and Distribution Agreement (including adjustments therein related to estimated income tax benefits arising from the liabilities allocated to us).
See Note 15 in the Consolidated Financial Statements for further discussion on indemnification obligations.
For a discussion of the risks associated with our Spin-Off from DuPont, see the section entitled “Risks Related to our Recent Spin-Off from DuPont” in in Part I, Item 1A. Risk Factors
36
RESULTS OF OPERATIONS
The Company utilized various allocation and carve-out methodologies through the date of the Distribution to prepare historical financial statements. The Consolidated Financial Statements for periods prior to the Separation herein may not be indicative of our future performance, do not necessarily include the actual expenses that would have been incurred by us and may not reflect our results of operations, financial position and cash flows had we been a separate, standalone company during the historical periods presented. For additional information, see “Basis of Presentation” in Note 1 – Background and Significant Accounting Policies to the accompanying Consolidated Financial Statements.
| Summary of Sales Results | For the Years Ended December 31, | ||||||||||
| In millions | 2025 | 2024 | 2023 | ||||||||
| Net sales | $ | 4,754 | $ | 4,335 | $ | 4,035 | |||||
| Sales Variances by Segment and Geographic Region | ||||||||||||||||||||||||||||||||
For the Year Ended December 31, 2025 | For the Year Ended December 31, 2024 | |||||||||||||||||||||||||||||||
| Percentage change from prior year | Local Price & Product Mix | Currency | Volume | Portfolio & Other | Total | Local Price & Product Mix | Currency | Volume | Portfolio & Other | Total | ||||||||||||||||||||||
| Semiconductor Technologies | (1) | % | — | % | 9 | % | — | % | 8 | % | (2) | % | (1) | % | 12 | % | — | % | 9 | % | ||||||||||||
| Interconnect Solutions | (2) | — | 14 | — | 12 | (2) | (1) | 9 | — | 6 | ||||||||||||||||||||||
| Total | (1) | % | — | % | 11 | % | — | % | 10 | % | (2) | % | (1) | % | 10 | % | — | % | 7 | % | ||||||||||||
| Americas | — | % | — | % | 13 | % | — | % | 13 | % | — | % | — | % | (4) | % | — | % | (4) | % | ||||||||||||
EMEA 1 | (1) | 1 | 6 | — | 6 | (2) | — | (1) | — | (3) | ||||||||||||||||||||||
| Asia Pacific | (1) | — | 11 | — | 10 | (2) | (1) | 14 | — | 11 | ||||||||||||||||||||||
| Total | (1) | % | — | % | 11 | % | — | % | 10 | % | (2) | % | (1) | % | 10 | % | — | % | 7 | % | ||||||||||||
1. Europe, Middle East and Africa.
2025 versus 2024
We reported net sales for the year ended December 31, 2025 of $4.8 billion, up 10% from $4.3 billion for the year ended December 31, 2024, primarily due to an 11% increase in sales volume partially offset by a 1% decrease in local price including metals pass-through and product mix. The volume increase was attributable to both Interconnect Solutions (up 14%) and Semiconductor Technologies (up 9%). Local price and product mix declined in both Interconnect Solutions (down 2%) and Semiconductor Technologies (down 1%).
2024 versus 2023
We reported net sales for the year ended December 31, 2024 of $4.3 billion, up 7% from $4.0 billion for the year ended December 31, 2023, primarily due to a 10% increase in sales volume partially offset by a 2% decrease in local price including metals pass-through and product mix and a 1% unfavorable currency impact. The volume increase was attributable to both Semiconductor Technologies (up 12%) and Interconnect Solutions (up 9%). Local price and product mix declined in both Interconnect Solutions and Semiconductor Technologies (both down 2%). The unfavorable currency impact was primarily driven by Japanese Yen, Chinese Yuan and South Korean Won.
Cost of Sales
Cost of sales was $2.6 billion for the year ended December 31, 2025, up from $2.3 billion for the year ended December 31, 2024. Cost of sales increased for the year ended December 31, 2025 primarily due to an increase in sales volume. Cost of sales as a percentage of net sales remained flat at 54% for the years ended December 31, 2025 and 2024.
For the year ended December 31, 2024, cost of sales was $2.3 billion, flat when compared to $2.3 billion for the year ended December 31, 2023. Cost of sales increased for the year ended December 31, 2024 due to increased sales volume of 6% were offset by decreases in raw materials, logistics and energy costs. Cost of sales as a percentage of net sales for the years ended December 31, 2024 was 54% compared with 57% for the year ended December 31, 2023.
37
Research and Development ("R&D") Expense
R&D expense was $354 million for the year ended December 31, 2025, up from $314 million for the year ended December 31, 2024 and $303 million for the year ended December 31, 2023. R&D as a percentage of net sales was 7% for the years ended December 31, 2025 and 2024, and 8% for the year ended December 31, 2023.
The increases in 2025 compared to 2024 and 2024 compared to 2023 were primarily due to increased investments and higher employee costs in each given year.
Selling, General and Administrative ("SG&A") Expenses
For the year ended December 31, 2025, SG&A expenses totaled $620 million, up from $603 million for the year ended December 31, 2024 and $533 million for the year ended December 31, 2023. SG&A as a percentage of net sales was 13%, 14%, and 13% for the years ended December 31, 2025, 2024 and 2023, respectively.
The increase in SG&A cost in 2025 compared to 2024 was primarily due to higher employee related costs, partially offset by a decrease in legal expenses. The increase in SG&A costs in 2024 compared with 2023 was primarily due to higher employee compensation and personnel related expenses.
Amortization of Intangibles
Amortization of intangibles was $207 million, $232 million and $262 million for the years ended December 31, 2025, 2024 and 2023, respectively. The decrease in amortization of intangibles from 2024 to 2025 and 2023 to 2024 was primarily due to the absence of amortization from fully amortized assets. See Note 13 to the Consolidated Financial Statements for additional information on intangible assets.
Restructuring and Asset Related Charges - Net
Restructuring and asset related charges - net were $20 million, $8 million and $52 million for the years ended December 31, 2025, 2024 and 2023, respectively. Activity for the years ended December 31, 2025, 2024 and 2023 represent nonrecurring charges in connection with DuPont approved restructuring programs to simplify certain organizational structures and operations, including operations related to transformational projects initiated prior to the Separation.
Activity in the year ended December 31, 2025 primarily relates to $19 million in charges for severance and related benefits and $1 million for an asset related charge. All charges were incurred prior to Separation with no charges subsequent to the Spin-Off. Activity in the year ended December 31, 2024 primarily relates to asset related charges. Activity in the year ended December 31, 2023 relates to a $39 million charge for severance and related benefits and $13 million for asset related charges. See Note 4 to the Consolidated Financial Statements for additional information.
Acquisition, Integration and Separation Costs
Acquisition, integration and separation costs were $25 million for the year ended December 31, 2025 and zero for each of the years ended 2024 and 2023. For the year ended December 31, 2025 these costs primarily related to financial advisory, accounting, legal, consulting, and other professional advisory fees related to the Separation.
Equity in Earnings of Nonconsolidated Affiliates
Our share of the earnings of nonconsolidated affiliates was $47 million, $37 million and $16 million for the years ended December 31, 2025, 2024 and 2023, respectively. The increase in earnings of nonconsolidated affiliates for the year ended December 31, 2025 and 2024 compared to the prior years is primarily due to higher earnings in the underlying nonconsolidated affiliates. See Note 12 to the Consolidated Financial Statements for additional information.
Interest Expense
Interest expense was $65 million for the year ended December 31, 2025 and zero for the years ended December 31, 2024 and 2023. Interest expense in 2025 was driven by interest associated with the Secured and Unsecured Notes and the Senior Secured Term Loan Facility (each as defined in Note 14 to the Consolidated Financial Statements), which were entered into during the year. Refer to Note 14 to the Consolidated Financial Statements for additional information.
Other Income (Expense) - Net
Other income (expense) - net includes a variety of income and expenses such as gain or loss on sale of assets and foreign currency exchange gains and losses. Other income (expense) - net for the year ended December 31, 2025 was $11 million of income compared with $25 million and $11 million of income in the years ended December 31, 2024 and 2023, respectively. See Note 6 to the Consolidated Financial Statements for additional information.
38
Provision for Income Taxes
Our effective tax rate fluctuates based on, among other factors, where income is earned and the level of income relative to tax attributes. For the year ended December 31, 2025, our effective tax rate was 24.2% on pre-tax income from operations of $962 million. The main drivers in the effective tax rate in 2025 are Pillar Two Qualified Domestic Minimum Top-up tax, unrecognized tax benefits, and the mix of earnings in the jurisdictions in which we operate.
For the year ended December 31, 2024, our effective tax rate was 19.6% on pre-tax income from operations of $901 million. The effective tax rate is lower than the U.S. corporate tax rate primarily as a result of the geographic mix of earnings, offset by a settlement in the second quarter of an international tax audit.
For the year ended December 31, 2023, our effective tax rate was 15.7% on pre-tax income from operations of $632 million. The effective tax rate is lower than the U.S. corporate tax rate primarily as a result of the geographic mix of earnings.
The underlying factors affecting our overall tax rate are summarized in Note 7 to the Consolidated Financial Statements.
39
SEGMENT RESULTS
Our measure of profit/loss for segment reporting purposes is Adjusted Operating EBITDA as this is the manner in which our Chief Operating Decision Maker ("CODM") assesses performance and allocates resources. Beginning with this reporting period, we are referring to our previously disclosed “Operating EBITDA” metric as “Adjusted Operating EBITDA". This represents a change in name only. We define Adjusted Operating EBITDA as earnings (i.e., “Income (loss) before income taxes") before interest, depreciation, amortization, non-operating pension / other post-employment benefits (“OPEB”) / charges, and foreign exchange gains / losses, indirect legacy costs, and adjusted for significant items.
SEMICONDUCTOR TECHNOLOGIES
| Semiconductor Technologies | For the Years Ended December 31, | ||||||||||
| In millions | 2025 | 2024 | 2023 | ||||||||
| Net sales | $ | 2,642 | $ | 2,450 | $ | 2,251 | |||||
Adjusted Operating EBITDA | $ | 945 | $ | 884 | $ | 777 | |||||
| Equity in earnings of nonconsolidated affiliates | $ | 48 | $ | 40 | $ | 21 | |||||
| Semiconductor Technologies | For the Years Ended December 31, | |||||||
| Percentage change from prior year | 2025 | 2024 | ||||||
| Change in Net Sales from Prior Period due to: | ||||||||
Local price & product mix | (1) | % | (2) | % | ||||
Currency | — | (1) | ||||||
Volume | 9 | 12 | ||||||
Portfolio & other | — | — | ||||||
Total | 8 | % | 9 | % | ||||
2025 Versus 2024
Semiconductor Technologies net sales were $2,642 million for the year ended December 31, 2025, up 8% from $2,450 million for the year ended December 31, 2024. Net sales increased primarily due to a 9% increase in volume partially offset by a 1% decline in local price and product mix. The increase in sales volume was due to ongoing end-market demand strength due to content gains in advanced nodes, share gains, and improved customer utilization rates, including in AI driven applications.
Adjusted Operating EBITDA was $945 million for the year ended December 31, 2025, up 7% compared with $884 million for the year ended December 31, 2024 primarily due to volume growth partially offset by select growth investments primarily within R&D.
2024 Versus 2023
Semiconductor Technologies net sales were $2,450 million for the year ended December 31, 2024, up 9% from $2,251 million for the year ended December 31, 2023. Volume gains were driven by end market demand recovery, led by artificial intelligence technology applications, advanced node transitions and higher China demand, as well as growth in OLED materials led by new product launches. Volume increases were partially offset by channel inventory destocking primarily within Kalrez®. The unfavorable currency impact was primarily driven by the Japanese Yen and South Korean Won.
Adjusted Operating EBITDA was $884 million for the year ended December 31, 2024, up 14% compared with $777 million for the year ended December 31, 2023 primarily due to volume growth and the impact of higher production rates partially offset by higher employee compensation and select growth investments primarily within R&D.
40
INTERCONNECT SOLUTIONS
| Interconnect Solutions | For the Years Ended December 31, | ||||||||||
| In millions | 2025 | 2024 | 2023 | ||||||||
| Net sales | $ | 2,112 | $ | 1,885 | $ | 1,784 | |||||
| Adjusted Operating EBITDA | $ | 539 | $ | 448 | $ | 333 | |||||
| Equity in losses of nonconsolidated affiliates | $ | (1) | $ | (3) | $ | (5) | |||||
| Interconnect Solutions | For the Years Ended December 31, | |||||||
| Percentage change from prior year | 2025 | 2024 | ||||||
| Change in Net Sales from Prior Period due to: | ||||||||
Local price & product mix | (2) | % | (2) | % | ||||
Currency | — | (1) | ||||||
Volume | 14 | 9 | ||||||
Portfolio & other | — | — | ||||||
Total | 12 | % | 6 | % | ||||
2025 Versus 2024
Interconnect Solutions net sales were $2,112 million for the year ended December 31, 2025, up 12% from $1,885 million for the year ended December 31, 2024. Net sales increased primarily due to a 14% increase in volume partially offset by a 2% decline in local price and product mix. The increase in sales volume was due to continued demand strength from AI driven technology ramps and new business gains in advanced packaging and thermal management applications.
Adjusted Operating EBITDA was $539 million for the year ended December 31, 2025, up 20% compared with $448 million for the year ended December 31, 2024 primarily due to an increase in sales volume, favorable mix and productivity gains partially offset by selective growth investments in SG&A and R&D.
2024 Versus 2023
Interconnect Solutions net sales were $1,885 million for the year ended December 31, 2024, up 6% from $1,784 million for the year ended December 31, 2023. Net sales increased primarily due to a 9% increase in volume partially offset by a 2% decline in local price and product mix, including the impact of lower pass-through metals, and a 1% unfavorable currency impact. Volume growth was driven by end market recovery led by AI driven technology ramps, improved PCB utilization and share gains. The unfavorable currency impact was primarily driven by the Japanese Yen and Chinese Yuan.
Adjusted Operating EBITDA was $448 million for the year ended December 31, 2024, up 35% compared with $333 million for the year ended December 31, 2023 primarily due to volume growth, the impact of higher production rates partially offset by higher employee compensation and select growth investments primarily within R&D.
41
LIQUIDITY & CAPITAL RESOURCES
Overview
Historically, the Electronics business, as previously managed by DuPont, has generated positive cash flows from operations. Prior to Separation, a majority of such cash flows were transferred to DuPont in connection with our participation in DuPont’s cash pooling arrangements to manage liquidity and fund operations, the effect of which is presented as net parent investment in our Consolidated Financial Statements.
Upon Separation, we ceased participation in DuPont cash pooling arrangements and our cash and cash equivalents are held and used solely for our own operations. Our capital structure, long-term commitments and sources of liquidity are meaningfully different from our historical practices. We believe our existing cash and cash flows generated from operations and indebtedness incurred in conjunction with the Separation, discussed in detail below, and anticipated domestic cash and cash equivalents we retained at the completion of the Separation will be responsive to the needs of our current and planned operations for at least the next 12 months.
Sources of Liquidity
Our principal sources of liquidity include cash on hand, cash generated from operations, availability under the Senior Secured Revolving Facility (described in Note 14 to the Consolidated Financial Statements), and potential access to debt and equity capital markets. We believe we will meet longer-term expected future cash requirements and obligations through a combination of our cash flow from operations and issuances of equity securities or debt offerings, as needed.
Capital Allocation Priorities
The Company's financial objectives through 2028 include a disciplined capital allocation plan that focuses on driving organic growth, making strategic investments, pursuing opportunistic mergers and acquisitions, and returning capital to shareholders.
| In millions | December 31, 2025 | December 31, 2024 | ||||||
| Cash and cash equivalents | $ | 915 | $ | 166 | ||||
| Total debt | $ | 4,027 | $ | — | ||||
The Company's cash and cash equivalents at December 31, 2025 and December 31, 2024 were $915 million and $166 million, respectively. As of December 31, 2025, $640 million of cash and cash equivalents were held by subsidiaries in foreign countries. Cash and cash equivalents of $166 million as of December 31, 2024 represents cash on hand at certain foreign entities as a result of local requirements. For each of its foreign subsidiaries, the Company makes an assertion regarding the amount of earnings intended for permanent reinvestment, with the balance available to be repatriated to the United States. The Company held no investments in marketable securities at December 31, 2025 and 2024. The increase in cash and cash equivalents at December 31, 2025 compared to December 31, 2024 was primarily driven by the establishment of cash balances through the completion of the Separation and Distribution.
Total debt at December 31, 2025 and 2024 was $4.0 billion and zero, respectively. The increase was due to the issuance of the Notes in August 2025 and the Company entering into the Senior Secured Term Loan Facility in October 2025. See Note 14 to the Consolidated Financial Statements for additional information. As of December 31, 2025, the Company was in compliance with all applicable covenants included in the terms of its debt arrangements.
As of December 31, 2025, the Company is contractually obligated to make future cash payments of $4.1 billion and $1.7 billion associated with principal and interest, respectively, on debt obligations. Related to the principal, $24 million will be due in the next twelve months and the remainder will be due subsequent to 2026. The Company may address the principal payment with cash on hand, utilizing existing credit facilities, accessing the debt capital markets or a combination of any of them. Related to interest, $265 million will be due in the next twelve months and the remainder will be due subsequent to 2026.
Cash Flows
Cash flows from operating, investing and financing activities are provided in the tables that follow. Individual amounts in the Consolidated Statements of Cash Flows exclude the effect of exchange rate impacts on cash and cash equivalents, which are presented separately in the cash flows. Thus, the amounts presented in the following operating, investing and financing activities tables reflect changes in balances from period to period adjusted for these effects.
42
The following table summarizes our cash flows:
Cash Flow Summary | For the Year ended December 31, | ||||||||||
In millions | 2025 | 2024 | 2023 | ||||||||
| Cash provided by (used for): | |||||||||||
| Operating activities | $ | 1,273 | $ | 1,061 | $ | 882 | |||||
| Investing activities | $ | (285) | $ | (172) | $ | (226) | |||||
| Financing activities | $ | (248) | $ | (848) | $ | (628) | |||||
| Effect of exchange rate changes on cash and cash equivalents | $ | 9 | $ | (14) | $ | (4) | |||||
Cash Flows provided by Operating Activities
Cash generated from operating activities was $1,273 million, $1,061 million and $882 million in 2025, 2024 and 2023, respectively.
In 2025, cash flows provided by operating activities increased compared to 2024, primarily due to higher earnings and an increase in accounts payable and employee related liabilities. The increase in accounts payable were primarily due to year-over-year timing of payments. The increase in employee related liabilities was due to increase in vacation and bonus accruals when compared to the prior year.
In 2024, cash flows provided by operating activities increased compared to 2023, primarily from higher earnings and a decrease in net cash used for working capital. Changes in working capital were primarily driven by higher trade receivables due to increased sales, higher inventory based on business activity, as well as increased accounts payable due to year-over-year timing of payments.
Cash Flows used for Investing Activities
Cash used for investing activities was $285 million, $172 million and $226 million in 2025, 2024 and 2023, respectively.
The increase in cash used for investing activities in 2025 versus 2024 was attributable to increased capital expenditures in 2025 and nonrecurring activity in 2024 that included $15 million of proceeds from the sales of property and $13 million generated from other investing activities.
Cash used for investing activities in 2024 included $200 million of cash used for capital expenditures offset by $15 million of proceeds from sales of property and other assets and $13 million generated from other investing activities.
The change in investing activities in 2024 versus 2023 was primarily due to lower capital expenditures and an increase in cash generated from proceeds from sales of property and cash generated from other investing activities.
Cash Flows used for Financing Activities
Cash used for financing activities was $248 million, $848 million and $628 million in 2025, 2024 and 2023, respectively.
In 2025, cash used for financing activities decreased primarily attributable to cash proceeds from the issuance of long-term debt, fully offset by an increase in net transfers to DuPont as a result of completion of the Separation and Distribution and payments for debt issuance costs.
In 2024, cash used for financing activities increased compared to 2023 primarily due to an increase in net transfers to DuPont.
Dividends
On November 12, 2025 the Board of Directors declared a quarterly dividend of six cents ($0.06) per share for each share of issued and outstanding common stock of the Company. The dividend was paid on December 15, 2025, to stockholders of record on November 28, 2025.
On December 9, 2025 the Board of Directors declared a quarterly dividend of eight cents ($0.08) per share for each share of issued and outstanding common stock of the Company. The dividend will be payable on March 16, 2026 to stockholders of record on February 27, 2026.
The Company currently expects quarterly dividends to continue in future periods, although they remain subject to determination and declaration by the Board of Directors. The payment of future dividends, if any, will be based on several factors, including the Company’s financial performance, outlook and liquidity.
43
Material Cash Requirements
In the normal course of business, we enter into contracts and commitments that oblige us to make payments in the future. Information regarding our obligations under lease, pension and commitments are provided in Note 16, Note 18 and Note 15, respectively, in the Consolidated Financial Statements for the years ended December 31, 2025, 2024 and 2023 contained elsewhere in this Annual Report.
After the Spin-Off, we are incurring costs related to operating as a stand-alone public company and our costs under the agreements entered into in connection with the Separation and Distribution, including certain cost sharing arrangements as well as indemnification obligations. While these costs will be significant, the Company expects the generation of cash from operations and the ability to access the debt capital markets and other sources of liquidity will continue to provide sufficient liquidity and financial flexibility to meet the Company’s and its subsidiaries’ obligations as they come due. However, we are not able to predict the full extent or timing of our future obligations given the contingent nature of our indemnification obligations or macroeconomic related impacts which depend on uncertain and unpredictable future developments.
| Long-Term Debt | December 31, 2025 | December 31, 2024 | ||||||||||||
| In millions | Amount | Weighted Average Rate | Amount | Weighted Average Rate | ||||||||||
| Promissory notes and debentures: | ||||||||||||||
| Secured Notes due 2032 | $ | 1,000 | 5.750 | % | $ | — | — | % | ||||||
| Unsecured Notes due 2033 | 750 | 6.250 | % | — | — | % | ||||||||
| Other facilities: | ||||||||||||||
| Senior secured term loan facility due 2032 | 2,350 | 5.698 | % | — | — | % | ||||||||
| Less: Unamortized debt discount and issuance costs | 73 | — | ||||||||||||
Less: Long-term debt due within one year | 24 | — | ||||||||||||
| Total | $ | 4,003 | $ | — | ||||||||||
See Note 14 in the Consolidated Financial Statements for further discussion on debt instruments.
Pension and Other Post-Employment Plans
The Company's funding policy is to contribute to defined benefit pension plans based on pension funding laws and local country requirements. Contributions exceeding funding requirements may be made at the Company's discretion. The Company expects to contribute approximately $6 million to its pension plans in 2026. The amount and timing of the Company’s actual future contributions will depend on applicable funding requirements, discount rates, investment performance, plan design, and various other factors, separations and distributions. See Note 18 to the Consolidated Financial Statements for additional information concerning the Company’s pension plans.
As of December 31, 2025, the Company is contractually obligated to make future cash contributions of $85 million related to pension and other post-employment benefit plans. Cash contributions of $6 million will be due in the next twelve months and the remainder will be due subsequent to 2026 with the majority due subsequent to 2031.
Other Contractual Obligations
Purchase obligations represents enforceable and legally binding agreements in excess of $1 million to purchase goods or services that specify fixed or minimum quantities; fixed minimum or variable price provisions; and the approximate timing of the agreement. As of December 31, 2025, the Company is contractually obligated to make future cash payments of $38 million related to purchase obligations, of which $23 million will be due in the next twelve months and the remainder will be due subsequent to 2026.
Lease obligations represents future finance and operating lease payments. As of December 31, 2025, obligations of future lease payments are $674 million, of which $65 million will be due in the next twelve months and remainder will be due subsequent to 2026.
As of December 31, 2025, the Company recorded indemnification liabilities for future payments due to DuPont of $461 million, of which $183 million will be due in the next twelve months and the remainder will be due subsequent to 2026. As of December 31, 2025, the Company recorded indemnification assets for future payments due from DuPont of $323 million, of which $205 million will be due in the next twelve months and the remainder will be due subsequent to 2026.
44
Other miscellaneous obligations includes liabilities related to deferred compensation and other noncurrent liabilities. As of December 31, 2025, the Company is contractually obligated to make future cash payments of $53 million related to other miscellaneous obligations, the majority of which is due subsequent to 2026.
RECENT ACCOUNTING PRONOUNCEMENTS
See Note 2 to the Consolidated Financial Statements for a description of recent accounting pronouncements.
CRITICAL ACCOUNTING ESTIMATES
The Company’s significant accounting policies are more fully described in Note 1 to the Consolidated Financial Statements. Management believes that the application of these policies on a consistent basis enables the Company to provide the users of the financial statements with useful and reliable information about the Company’s operating results and financial condition.
The preparation of the Consolidated Financial Statements in conformity with accounting principles generally accepted in the United States of America ("U.S. GAAP") requires management to make estimates and assumptions that affect the reported amounts, including, but not limited to, receivable and inventory valuations, impairment of tangible and intangible assets, long-term employee benefit obligations, income taxes, restructuring liabilities, environmental matters and litigation. Management’s estimates are based on historical experience, facts and circumstances available at the time and various other assumptions that are believed to be reasonable. The Company reviews these matters and reflects changes in estimates as appropriate. Management believes that the following represent some of the more critical judgment areas in the application of the Company’s accounting policies which could have a material effect on the Company’s financial position, liquidity or results of operations.
Legal Commitments and Contingencies
The Company’s results of operations could be affected by material litigation adverse to the Company, including patent infringement claims, employment claims, including alleged wage and hour violations, and commercial claims. The Company records accruals for legal matters when the information available indicates that it is probable that a liability has been incurred and the amount of the loss can be reasonably estimated. Management makes adjustments to these accruals to reflect the impact and status of negotiations, settlements, rulings, advice of counsel and other information and events that may pertain to a particular matter. Predicting the outcome of claims and lawsuits and estimating related costs and exposure involves substantial uncertainties that could cause actual costs to vary materially from estimates. In making determinations of likely outcomes of litigation matters, management considers many factors. These factors include, but are not limited to, the nature of specific claims including unasserted claims, the Company’s experience with similar types of claims, the jurisdiction in which the matter is filed, input from outside legal counsel, the likelihood of resolving the matter through alternative dispute resolution mechanisms and the matter’s current status. Considerable judgment is required in determining whether to establish a litigation accrual when an adverse judgment is rendered against the Company in a court proceeding. In such situations, the Company will not recognize a loss if, based upon a thorough review of all relevant facts and information, management believes that it is probable that the pending judgment will be successfully overturned on appeal. A detailed discussion of material litigation matters is contained in Note 15 to the Consolidated Financial Statements.
Income Taxes
Qnity is included in the combined U.S. federal, state and certain foreign income tax returns of the DuPont parent entity for periods prior to November 1, 2025 and files its own tax returns for periods after that date. For periods prior to November 1, 2025, we have adopted the separate return approach for purposes of our Consolidated Financial Statements. The income tax provisions and related deferred tax assets and liabilities reflected in our Consolidated Financial Statements have been estimated as if we were a separate taxpayer. The breadth of the Company’s operations and the global complexity of tax regulations require assessments of uncertainties and judgments in estimating taxes the Company will ultimately pay. The final taxes paid are dependent upon many factors, including ongoing federal, state and international tax audits in various jurisdictions in the normal course of business, negotiations with taxing authorities in various jurisdictions, and outcomes of tax litigation and resolution of disputes arising from income tax audits. The resolution of these uncertainties may result in adjustments to the Company’s tax assets and tax liabilities and could be material. The impact, if any, of these audits to the Company’s unrecognized tax benefits is not estimable.
Deferred income taxes result from differences between the financial and tax basis of the Company’s assets and liabilities and are adjusted for changes in tax rates and tax laws when changes are enacted. Valuation allowances are recorded to reduce deferred tax assets when it is more likely than not that a tax benefit will not be realized. Significant judgment is required in evaluating the need for and magnitude of appropriate valuation allowances against deferred tax assets. The realization of these assets is dependent on generating future taxable income, as well as successful implementation of various tax planning strategies.
45
Changes in facts and circumstances that alter the probability that the Company will realize deferred tax assets could result in deferred tax expense in the relevant period and could be material.
See Note 7 in the Consolidated Financial Statements for further information on income taxes.
Assessments of Long-Lived Assets and Goodwill
Assessment of the potential impairment of goodwill, other intangible assets, property, plant and equipment, investments in nonconsolidated affiliates and other assets is an integral part of the Company’s normal ongoing review of operations. Testing for potential impairment of these assets is significantly dependent on numerous assumptions and reflects management’s best estimates at a particular point in time. The dynamic economic environments in which the Company’s diversified product lines operate, and key economic and product line assumptions with respect to projected selling prices, market growth and inflation rates, can significantly affect the outcome of impairment tests. Estimates based on these assumptions may differ significantly from actual results. Changes in factors and assumptions used in assessing potential impairments can have a significant impact on the existence and magnitude of impairments, as well as the time in which such impairments are recognized. In addition, the Company continually reviews its diverse portfolio of assets to ensure they are achieving their greatest potential and are aligned with the Company’s growth strategy. Strategic decisions involving a particular group of assets may trigger an assessment of the recoverability of the related assets. Such an assessment could result in impairment losses.
The Company performs its annual goodwill impairment testing during the fourth quarter, or more frequently when events or changes in circumstances indicate that the fair value is below carrying value, at the reporting unit level, which is defined as the operating segment or one level below the operating segment. One level below the operating segment, or component, is a business in which discrete financial information is available and regularly reviewed by segment management. The Company aggregates certain components into reporting units based on economic similarities. As of December 31, 2025, the Company has two reporting units.
For purposes of goodwill impairment testing, the Company has the option to first perform qualitative testing to determine whether it is more likely than not that the fair value of a reporting unit is less than its carrying value. The qualitative evaluation is an assessment of factors, including reporting unit or asset specific operating results and cost factors, as well as industry, market and macroeconomic conditions, to determine whether it is more likely than not that the fair value of a reporting unit or asset is less than the respective carrying amount, including goodwill. If the Company chooses not to complete a qualitative assessment for a given reporting unit or if the initial assessment indicates that it is more likely than not that the carrying value of a reporting unit exceeds its estimated fair value, additional quantitative testing is required.
If additional quantitative testing is performed, an impairment loss is recognized when the amount by which the carrying value of the reporting unit exceeds its fair value, limited to the amount of goodwill at the reporting unit. The Company determines fair values for each of the reporting units using a combination of the income approach and market approach.
Under the income approach, fair value is determined based on the present value of estimated future cash flows, discounted at an appropriate risk-adjusted rate. The Company uses internal forecasts to estimate future cash flows and includes an estimate of long-term future growth rates based on its most recent views of the long-term outlook for each reporting unit. Management’s discounted cash flow model includes significant assumptions, including projected revenue growth, earnings before interest, taxes, depreciation and amortization ("EBITDA") margin, weighted average cost of capital, terminal growth rate and the tax rate. These key assumptions are determined through evaluation of the Company as a whole, underlying business fundamentals and industry risk. The Company derives its discount rates using a capital asset pricing model and analyzing published rates for industries relevant to its reporting units to estimate the cost of equity financing. The Company uses discount rates that are commensurate with the risks and uncertainty inherent in the respective reporting units and in its internally developed forecasts.
Under the market approach, the Company applies the Guideline Public Company Method utilizing Level 3 unobservable inputs. Selected peer sets are based on close competitors, publicly traded companies and reviews of analysts’ reports, public filings and industry research. In selecting the EBITDA multiples and determining the fair value, the Company considers the size, growth and profitability of each reporting unit versus the relevant guideline public companies. When applicable, third-party purchase offers may be utilized to measure fair value.
Estimating the fair value of reporting units requires the use of estimates and significant judgments that are based on a number of factors including actual operating results. It is reasonably possible that the judgments and estimates described above could change in future periods.
See Note 13 in the Consolidated Financial Statements for further information on goodwill.
46
ITEM 7A. QUANTITATIVE AND QUALITATIVE DISCLOSURES ABOUT MARKET RISK
We are exposed to certain market risks relating to fluctuations in foreign currency exchange rates, commodity prices and interest rates. Management has established a variety of programs including the use of derivative instruments and other financial instruments to manage the exposure to financial market risks as to minimize volatility of financial results. In the ordinary course of business, management may enter into derivative instruments to hedge its exposure to foreign currency, interest rate and commodity price risks under established procedures and controls. Decisions regarding whether or not to hedge a given commitment are made on a case-by-case basis, taking into consideration the amount and duration of the exposure, market volatility and economic trends. Foreign currency exchange contracts are also used, from time to time, to manage near-term foreign currency cash requirements.
Foreign Exchange Risk
The Company has significant international operations resulting in a large number of currency transactions from international sales, purchases, investments and borrowings. The primary currencies for which the Company has an exchange rate exposure are the Chinese renminbi ("CNY"), Japanese yen ("JPY"), the Taiwan dollar ("TWD"), European euro ("EUR") and South Korean won ("KRW"). The Company uses forward exchange contracts to offset its net exposures, by currency, related to the foreign currency denominated monetary assets and liabilities of its operations. In addition to the contracts disclosed in Note 20 to the Consolidated Financial Statements, from time to time, the Company will enter into foreign currency exchange contracts to establish with certainty the U.S. dollar ("USD") amount of future firm commitments denominated in a foreign currency.
The following table illustrates the fair values of outstanding foreign currency contracts at December 31, 2025 and the effect on fair values of a hypothetical adverse change in the foreign exchange rates that existed at December 31, 2025. The sensitivities for foreign currency contracts are based on a 10 percent adverse change in foreign exchange rates.
| December 31, 2025 | ||||||||
| In millions | Fair Value Asset/(Liability) | Fair Value Sensitivity | ||||||
| Foreign currency contracts | $ | 14 | $ | (73) | ||||
Interest Rate Risk
We are exposed to market risk from changes in interest rates. Interest rate risk arises primarily from borrowings under our Senior Secured Term Loan Facility, which bears interest at variable rates. Changes in interest rates could affect the Company’s interest expense and cash flows.
As of December 31, 2025, the Company had $2.35 billion outstanding under its senior secured term loan facility with an weighted average interest rate of 5.698%. Borrowings under the Senior Secured Credit Facilities bear interest at a rate per annum equal to either (i) the applicable base rate or (ii) term Secured Overnight Financing Rate (“SOFR”), in each case plus an applicable margin. The applicable margin for borrowings under the Senior Secured Revolving Facility ranges from 0.25% to 1.25% for base rate borrowings and 1.25% to 2.25% for term SOFR borrowings, in each case based on the Company’s consolidated first lien net leverage ratio. The applicable margin for borrowings under the Senior Secured Term Loan Facility is 1.00% for base rate borrowings and 2.00% for term SOFR borrowings. A fluctuation in the weighted average interest rate of 100 basis points as of December 31, 2025, would result in an increase or decrease in annual interest expense of $24 million in relation to our Senior Secured Term Loan.
Concentration of Credit Risk
The Company maintains cash and cash equivalents, derivatives and certain other financial instruments with various financial institutions. These financial institutions are generally highly rated and geographically dispersed, and the Company has a policy to limit the dollar amount of credit exposure with any one institution.
As part of the Company’s financial risk management processes, it continuously evaluates the relative credit standing of all the financial institutions that service Qnity and monitors actual exposures versus established limits. The Company has not sustained credit losses from instruments held at financial institutions.
For the year ended December 31, 2025, Samsung Electronics Co., Ltd. accounted for approximately 11% of total net sales and Taiwan Semiconductor Manufacturing Company Limited accounted for approximately 8% of total net sales. The concentration of credit risk related to accounts receivable is consistent with the geographic, industry, and customer diversity associated with the Company’s global product portfolio.
47
The Company also maintains strong credit controls in evaluating and granting customer credit. As a result, it may require that customers provide some type of financial guarantee in certain circumstances. Length of terms for customer credit varies by industry and region.
ITEM 8. FINANCIAL STATEMENTS AND SUPPLEMENTARY DATA
The financial statements and supplementary data required by this Item are included herein, commencing on page F-1 of this report.
ITEM 9. CHANGES IN AND DISAGREEMENTS WITH ACCOUNTANTS ON ACCOUNTING AND FINANCIAL DISCLOSURE
None.
ITEM 9A. CONTROLS AND PROCEDURES
Evaluation of Disclosure Controls and Procedures
The Company maintains a system of disclosure controls and procedures to give reasonable assurance that information required to be disclosed in the Company's reports filed or submitted under the Securities Exchange Act of 1934, as amended (the “Exchange Act”), is recorded, processed, summarized and reported within the time periods specified in the rules and forms of the SEC. These controls and procedures also give reasonable assurance that information required to be disclosed in such reports is accumulated and communicated to management to allow timely decisions regarding required disclosures.
As of December 31, 2025, our Chief Executive Officer ("CEO") and Chief Financial Officer ("CFO"), together with management, conducted an evaluation of the effectiveness of our disclosure controls and procedures (as that term is defined in Rules 13a-15(e) and 15d-15(e) under the Exchange Act). Based on that evaluation, the CEO and CFO concluded that these disclosure controls and procedures were effective as of December 31, 2025 at the reasonable assurance level.
Changes in Internal Control Over Financial Reporting
There were no changes in the Company's internal control over financial reporting (as defined in Rules 13a-15(f) and 15d-15(f) under the Exchange Act) that occurred during the quarter ended December 31, 2025 that have materially affected, or are reasonably likely to materially affect, the Company's internal control over financial reporting.
Notwithstanding the above, prior to November 1, 2025, we relied on certain material processes and internal controls over financial reporting performed by DuPont. As a result of the Separation from DuPont on November 1, 2025, we are in the process of reviewing, revising and adopting policies, as needed, to meet all regulatory requirements applicable to us as an independent, publicly traded company. In addition, in connection with our Separation, we entered into Transition Services Agreements, pursuant to which DuPont will continue to provide certain information technology, administrative and other services on a transitional basis.
Management's Annual Report on Internal Control Over Financial Reporting
This Annual Report does not include a report of management's assessment regarding internal control over financial reporting or an attestation report of our registered public accounting firm due to a transition period established by rules of the U.S. Securities and Exchange Commission for newly public companies.
ITEM 9B. OTHER INFORMATION
During the three months ended December 31, 2025, no director or officer of the Company adopted terminated
ITEM 9C. Disclosure Regarding Foreign Jurisdictions that Prevent Inspections
Not applicable.
48
| Qnity Electronics, Inc. | ||||||||
| PART III | ||||||||
ITEM 10. DIRECTORS, EXECUTIVE OFFICERS AND CORPORATE GOVERNANCE
Other than as set forth below, information required by this item has been omitted from this report, and is incorporated by reference to our Definitive Proxy Statement for our Annual Meeting of Stockholders to be held on May 21, 2026 (the “Annual Meeting”), which will be filed with the SEC within 120 days of our 2025 fiscal year end.
We have adopted Code of Conduct, which are applicable to all of our directors, officers and employees, including our principal executive officer, principal financial officer, principal accounting officer or persons performing similar functions. The Code of Conduct provides a framework for sound ethical business decisions and sets forth our expectations on a number of topics, including conflicts of interest, compliance with laws, use of our assets and business ethics. The Code of Conduct is available on our website at ir.qnityelectronics.com. The information on, or otherwise accessible through, our website does not constitute a part of this Annual Report. If we ever were to amend or waive any provision of our Code of Conduct that applies to our principal executive officer, principal financial officer, principal accounting officer or any person performing similar functions, we intend to satisfy our disclosure obligations, if any, with respect to any such waiver or amendment by posting such information on the website set forth above rather than by filing a Current Report on Form 8-K. In the case of a waiver for an executive officer or a director, the disclosure required under applicable New York Stock Exchange listing standards also will be made available on our website.
ITEM 11. EXECUTIVE COMPENSATION
Information required by this item has been omitted from this report, and is incorporated by reference to our Definitive Proxy Statement for our Annual Meeting, which will be filed with the SEC within 120 days of our 2025 fiscal year end.
ITEM 12. SECURITY OWNERSHIP OF CERTAIN BENEFICIAL OWNERS AND MANAGEMENT AND RELATED STOCKHOLDER MATTERS
Information required by this item has been omitted from this report, and is incorporated by reference to our Definitive Proxy Statement for our Annual Meeting, which will be filed with the SEC within 120 days of our 2025 fiscal year end.
ITEM 13. CERTAIN RELATIONSHIPS AND RELATED TRANSACTIONS, AND DIRECTOR INDEPENDENCE
Information required by this item has been omitted from this report, and is incorporated by reference to our Definitive Proxy Statement for our Annual Meeting, which will be filed with the SEC within 120 days of our 2025 fiscal year end.
ITEM 14. PRINCIPAL ACCOUNTING FEES AND SERVICES
Information required by this item has been omitted from this report, and is incorporated by reference to our Definitive Proxy Statement for our Annual Meeting, which will be filed with the SEC within 120 days of our 2025 fiscal year end.
49
| Qnity Electronics, Inc. | ||||||||
| PART IV | ||||||||
ITEM 15. EXHIBITS AND FINANCIAL STATEMENT SCHEDULES
(a)Financial Statements and Financial Statement Schedules:
1.Financial Statements (See the Index to the Consolidated Financial Statements on page F-1 of this report).
2.Financial Statement Schedules
Schedule II—Valuation and Qualifying Accounts
| (In millions) for the years ended December 31, | 2025 | 2024 | 2023 | ||||||||
| Accounts Receivable—Allowance for Doubtful Receivables | |||||||||||
| Balance at beginning of period | $ | $ | $ | ||||||||
| Additions charged to expenses | ( | ||||||||||
Deductions from reserves 1 | ( | ||||||||||
| Balance at end of period | $ | $ | $ | ||||||||
| Inventory—Obsolescence Reserve | |||||||||||
| Balance at beginning of period | $ | $ | $ | ||||||||
| Additions charged to expenses | |||||||||||
Deductions from reserves 2 | ( | ( | ( | ||||||||
| Balance at end of period | $ | $ | $ | ||||||||
| Deferred Tax Assets—Valuation Allowance | |||||||||||
| Balance at beginning of period | $ | $ | $ | ||||||||
Additions 3 | |||||||||||
Deductions from reserves 3 | ( | ||||||||||
| Adjustments through equity in connection with separation | |||||||||||
| Balance at end of period | $ | $ | $ | ||||||||
1.Deductions include write-offs, recoveries and currency translation adjustments.
2.Deductions include disposals and currency translation adjustments.
3.Additions and Deductions include currency translation adjustments.
Financial Statement Schedules listed under the SEC rules but not included in this report are omitted because they are not applicable or the required information is shown in the Consolidated Financial Statements or notes thereto incorporated by reference.
50
(b) Exhibits required to be filed by Item 601 of Regulation S-K:
| EXHIBIT NO. | DESCRIPTION | ||||||||||
2.1+ | Separation and Distribution Agreement by and between DuPont de Nemours, Inc. and Qnity Electronics, Inc. (Incorporated by reference to Exhibit 2.1 to the Company’s Current Report on Form 8-K (File No. 001-42619) filed with the SEC on November 3, 2025). | ||||||||||
| Amended and Restated Certificate of Incorporation of Qnity Electronics, Inc. (Incorporated by reference to Exhibit 3.2 to the Company’s Current Report on Form 8-K (File No. 001-42619) filed with the SEC on November 3, 2025). | |||||||||||
| Certificate of Designation of Qnity Electronics, Inc. (included in Exhibit 3.2) (Incorporated by reference to Exhibit 3.1 to the Company’s Current Report on Form 8-K (File No. 001-42619) filed with the SEC on November 3, 2025). | |||||||||||
| Amended and Restated Bylaws of Qnity Electronics, Inc. (Incorporated by reference to Exhibit 3.3 to the Company’s Current Report on Form 8-K (File No. 001-42619) filed with the SEC on November 3, 2025). | |||||||||||
4.1* | Description of the Registrant's Securities. | ||||||||||
| Indenture, dated as of August 15, 2025, by and between Qnity Electronics, Inc. and U.S. Bank Trust Company, National Association, as trustee and notes collateral agent (incorporated by reference to Exhibit 10.7 to Amendment No. 4 to Qnity Electronics, Inc.’s registration statement on Form 10, filed with the U.S. Securities and Exchange Commission on September 29, 2025). | |||||||||||
| Indenture, dated as of August 15, 2025, by and between Qnity Electronics, Inc. and U.S. Bank Trust Company, National Association, as trustee (incorporated by reference to Exhibit 10.8 to Amendment No. 4 to Qnity Electronics, Inc.’s registration statement on Form 10, filed with the U.S. Securities and Exchange Commission on September 29, 2025). | |||||||||||
| First Supplemental Indenture, dated as of November 1, 2025, by and among Qnity Electronics, Inc., the U.S. Guarantors and U.S. Bank Trust Company, National Association, as trustee and notes collateral agent (Incorporated by reference to Exhibit 4.2 to the Company’s Current Report on Form 8-K (File No. 001-42619) filed with the SEC on November 3, 2025). | |||||||||||
| Second Supplemental Indenture, dated as of November 2, 2025, by and among Qnity Electronics, Inc., the Foreign Guarantors and U.S. Bank Trust Company, National Association, as trustee and notes collateral agent (Incorporated by reference to Exhibit 4.3 to the Company’s Current Report on Form 8-K (File No. 001-42619) filed with the SEC on November 3, 2025). | |||||||||||
| First Supplemental Indenture, dated as of November 1, 2025, by and among Qnity Electronics, Inc., the U.S. Guarantors and U.S. Bank Trust Company, National Association, as trustee (Incorporated by reference to Exhibit 4.5 to the Company’s Current Report on Form 8-K (File No. 001-42619) filed with the SEC on November 3, 2025). | |||||||||||
| Second Supplemental Indenture, dated as of November 2, 2025, by and among Qnity Electronics, Inc., the Foreign Guarantors and U.S. Bank Trust Company, National Association, as trustee (Incorporated by reference to Exhibit 4.6 to the Company’s Current Report on Form 8-K (File No. 001-42619) filed with the SEC on November 3, 2025). | |||||||||||
| Letter Agreement, dated as of June 1, 2019, by and between DuPont de Nemours, Inc. (f/k/a DowDuPont Inc.) and Corteva, Inc. (Incorporated by reference to Exhibit 10.5 to the Company’s Registration Statement on Form 10, as amended (File No. 001-42619) filed with the SEC on September 29, 2025). | |||||||||||
| Tax Matters Agreement, effective as of November 1, 2025, by and between DuPont de Nemours, Inc. and Qnity Electronics, Inc. (Incorporated by reference to Exhibit 10.1 to the Company’s Current Report on Form 8-K (File No. 001-42619) filed with the SEC on November 3, 2025). | |||||||||||
| Employee Matters Agreement, effective as of November 1, 2025, by and between DuPont de Nemours, Inc. and Qnity Electronics, Inc. (Incorporated by reference to Exhibit 10.2 to the Company’s Current Report on Form 8-K (File No. 001-42619) filed with the SEC on November 3, 2025). | |||||||||||
51
| Transition Services Agreement, effective as of November 1, 2025, by and between DuPont Specialty Products USA, LLC and EKC Advanced Electronics USA, LLC (Incorporated by reference to Exhibit 10.3 to the Company’s Current Report on Form 8-K (File No. 001-42619) filed with the SEC on November 3, 2025). | |||||||||||
| Intellectual Property Cross-License Agreement, effective as of November 1, 2025, by and among DuPont de Nemours, Inc., Qnity Electronics, Inc. and certain of their respective affiliates (Incorporated by reference to Exhibit 10.4 to the Company’s Current Report on Form 8-K (File No. 001-42619) filed with the SEC on November 3, 2025). | |||||||||||
| Legacy Liabilities Assignment Agreement, effective as of November 1, 2025, by and between DuPont de Nemours, Inc. and Qnity Electronics, Inc. (Incorporated by reference to Exhibit 10.5 to the Company’s Current Report on Form 8-K (File No. 001-42619) filed with the SEC on November 3, 2025). | |||||||||||
| Credit Agreement, effective as of October 31, 2025, by and among Qnity Electronics, Inc., JPMorgan Chase Bank, N.A. and the other parties thereto (Incorporated by reference to Exhibit 10.6 to the Company’s Current Report on Form 8-K (File No. 001-42619) filed with the SEC on November 3, 2025). | |||||||||||
10.8# | Qnity Electronics, Inc.’s Equity and Incentive Plan (Incorporated by reference to Exhibit 4.4 to the Company’s Registration Statement on Form S-8 (File No. 333-291198) filed with the SEC on October 31, 2025). | ||||||||||
10.9# | Qnity Electronics, Inc.’s Stock Accumulation and Deferred Compensation Plan for Directors (Incorporated by reference to Exhibit 4.5 to the Company’s Registration Statement on Form S-8 (File No. 333-291198) filed with the SEC on October 31, 2025). | ||||||||||
| Qnity Electronics, Inc.’s Senior Executive Severance Plan (Incorporated by reference to Exhibit 10.10 to the Company’s Quarterly Report on Form 10-Q (File No. 333-42619) filed with the SEC on November 18, 2025. | |||||||||||
| Qnity Electronics, Inc.’s Management Deferred Compensation Plan (Incorporated by reference to Exhibit 10.11 to the Company’s Quarterly Report on Form 10-Q (File No. 333-42619) filed with the SEC on November 18, 2025. | |||||||||||
| Qnity Electronics, Inc.’s Retirement Savings Restoration Plan (Incorporated by reference to Exhibit 10.12 to the Company’s Quarterly Report on Form 10-Q (File No. 333-42619) filed with the SEC on November 18, 2025. | |||||||||||
10.13*# | Qnity Electronics, Inc.’s Form of Performance-Based Restricted Stock Unit Award | ||||||||||
10.14*# | Qnity Electronics, Inc.’s Form of Restricted Stock Unit Award | ||||||||||
19.1* | |||||||||||
21.1* | Subsidiaries of the Registrant. | ||||||||||
23.1* | Consent of Independent Registered Public Accounting Firm, PricewaterhouseCoopers LLP. | ||||||||||
31.1* | Certification Pursuant to Section 302 of the Sarbanes-Oxley Act of 2002. | ||||||||||
31.2* | Certification Pursuant to Section 302 of the Sarbanes-Oxley Act of 2002. | ||||||||||
32.1** | Certification Pursuant to Section 906 of the Sarbanes-Oxley Act of 2002. | ||||||||||
32.2** | Certification Pursuant to Section 906 of the Sarbanes-Oxley Act of 2002. | ||||||||||
97.1* | Qnity Electronics, Inc. Clawback Policy | ||||||||||
| 101.INS | XBRL Instance Document – the instance document does not appear in the Interactive Data File because its XBRL tags are embedded within the Inline XBRL document. | ||||||||||
| 101.SCH | XBRL Taxonomy Extension Schema Document. | ||||||||||
| 101.CAL | XBRL Taxonomy Extension Calculation Linkbase Document. | ||||||||||
| 101.DEF | XBRL Taxonomy Extension Definition Linkbase Document. | ||||||||||
| 101.LAB | XBRL Taxonomy Extension Label Linkbase Document. | ||||||||||
| 101.PRE | XBRL Taxonomy Extension Presentation Linkbase Document. | ||||||||||
| 104 | Cover Page Interactive Data File (formatted as Inline XBRL and contained in Exhibit 101). | ||||||||||
+ Certain schedules or similar attachments have been omitted pursuant to Item 601(a)(5) of Regulation S-K. The registrant agrees to furnish supplemental copies of any of the omitted schedules or attachments upon request by the SEC.
52
*Filed herewith
** Furnished herewith and not deemed to be “filed” for purposes of Section 18 of the Exchange Act and shall not be deemed to be incorporated by reference into any filing under the Securities Act or the Exchange Act (whether made before or after the date of this Annual Report on Form 10-K), irrespective of any general incorporation language contained in such filing.
# Indicates a management contract or compensatory plan or arrangement.
The agreements and other documents filed as exhibits to this report are not intended to provide factual information or other disclosure except for the terms of the agreements or other documents themselves, and you should not rely on them for other than that purpose. In particular, any representations and warranties made by the Company in these agreements or other documents were made solely within the specific context of the relevant agreement or document and do not apply in any other context or at any time other than the date they were made.
ITEM 16. FORM 10-K SUMMARY
None.
53
Qnity Electronics, Inc. Signatures | ||
Pursuant to the requirements of Section 13 or 15(d) of the Securities Exchange Act of 1934, the registrant has duly caused this report to be signed on its behalf by the undersigned, thereunto duly authorized.
QNITY ELECTRONICS, INC.
Registrant
Date: February 26, 2026
| By: | /s/ MICHAEL G. GOSS | |||||||||||||
| Name: | Michael G. Goss | |||||||||||||
| Title: | Interim Chief Financial Officer | |||||||||||||
Pursuant to the requirements of the Securities Exchange Act of 1934, this report has been signed below by the following persons on behalf of the registrant and in the capacities and on the dates indicated.
| Signature | Title(s) | Date | |||||||||||||||
| /s/ JON D. KEMP | Chief Executive Officer and Director (Principal Executive Officer) | February 26, 2026 | |||||||||||||||
| Jon D. Kemp | |||||||||||||||||
| /s/ MICHAEL G. GOSS | Interim Chief Financial Officer | February 26, 2026 | |||||||||||||||
| Michael G. Goss | (Principal Financial Officer and Principal Accounting Officer) | ||||||||||||||||
54
Pursuant to the requirements of the Securities Exchange Act of 1934, this report has been signed below by the following persons on behalf of the registrant and in the capacities and on the date indicated:
| Signature | Title(s) | Date | |||||||||||||||
| /s/ MARK A. BLINN | Chair of the Board of Directors | February 26, 2026 | |||||||||||||||
| Mark A. Blinn | |||||||||||||||||
| /s/ DR. SHUMEET BANERJI | Director | February 26, 2026 | |||||||||||||||
| Dr. Shumeet Banerji | |||||||||||||||||
| /s/ TERRENCE R. CURTIN | Director | February 26, 2026 | |||||||||||||||
| Terrence R. Curtin | |||||||||||||||||
| /s/ KARIN DE BONDT | Director | February 26, 2026 | |||||||||||||||
| Karin De Bondt | |||||||||||||||||
| /s/ BYRON GREEN | Director | February 26, 2026 | |||||||||||||||
| Byron Green | |||||||||||||||||
| /s/ DR. KRISTINA M. JOHNSON | Director | February 26, 2026 | |||||||||||||||
| Dr. Kristina M. Johnson | |||||||||||||||||
| /s/ ANNE NOONAN | Director | February 26, 2026 | |||||||||||||||
| Anne Noonan | |||||||||||||||||
| /s/ DR. YI HYON PAIK | Director | February 26, 2026 | |||||||||||||||
| Dr. Yi Hyon Paik | |||||||||||||||||
| /s/ STEVEN M. STERIN | Director | February 26, 2026 | |||||||||||||||
| Steven M. Sterin | |||||||||||||||||
55
Qnity Electronics, Inc.
Index to the Consolidated Financial Statements
F-1
Report of Independent Registered Public Accounting Firm
To the Board of Directors and Stockholders of Qnity Electronics, Inc.
Opinion on the Financial Statements
We have audited the accompanying consolidated balance sheets of Qnity Electronics, Inc. and its subsidiaries (the "Company") as of December 31, 2025 and 2024, and the related consolidated statements of operations, of comprehensive income, of equity and of cash flows for each of the three years in the period ended December 31, 2025, including the related notes and schedule of valuation and qualifying accounts for each of the three years in the period ended December 31, 2025 appearing under Item 15(a)(2) (collectively referred to as the "consolidated financial statements"). In our opinion, the consolidated financial statements present fairly, in all material respects, the financial position of the Company as of December 31, 2025 and 2024, and the results of its operations and its cash flows for each of the three years in the period ended December 31, 2025 in conformity with accounting principles generally accepted in the United States of America.
Basis for Opinion
These consolidated financial statements are the responsibility of the Company’s management. Our responsibility is to express an opinion on the Company’s consolidated financial statements based on our audits. We are a public accounting firm registered with the Public Company Accounting Oversight Board (United States) (PCAOB) and are required to be independent with respect to the Company in accordance with the U.S. federal securities laws and the applicable rules and regulations of the Securities and Exchange Commission and the PCAOB.
We conducted our audits of these consolidated financial statements in accordance with the standards of the PCAOB. Those standards require that we plan and perform the audits to obtain reasonable assurance about whether the consolidated financial statements are free of material misstatement, whether due to error or fraud.
Our audits included performing procedures to assess the risks of material misstatement of the consolidated financial statements, whether due to error or fraud, and performing procedures that respond to those risks. Such procedures included examining, on a test basis, evidence regarding the amounts and disclosures in the consolidated financial statements. Our audits also included evaluating the accounting principles used and significant estimates made by management, as well as evaluating the overall presentation of the consolidated financial statements. We believe that our audits provide a reasonable basis for our opinion.
Critical Audit Matters
The critical audit matter communicated below is a matter arising from the current period audit of the consolidated financial statements that was communicated or required to be communicated to the audit committee and that (i) relates to accounts or disclosures that are material to the consolidated financial statements and (ii) involved our especially challenging, subjective, or complex judgments. The communication of critical audit matters does not alter in any way our opinion on the consolidated financial statements, taken as a whole, and we are not, by communicating the critical audit matter below, providing a separate opinion on the critical audit matter or on the accounts or disclosures to which it relates.
Revenue Recognition – Product Sales
As described in Notes 1 and 3 to the consolidated financial statements, the Company’s total net sales were $4,754 million for the year ended December 31, 2025, of which a majority relates to product sales. Product sales consist of sales to supply manufacturers and distributors. Revenue is recognized when the customer obtains control of the product, which occurs at a point in time, usually upon shipment, and in an amount that reflects the consideration which the Company expects to receive in exchange for those goods.
The principal consideration for our determination that performing procedures relating to revenue recognition for product sales is a critical audit matter is a high degree of auditor effort in performing procedures related to the Company’s revenue recognition.
Addressing the matter involved performing procedures and evaluating audit evidence in connection with forming our overall opinion on the consolidated financial statements. These procedures included, among others (i) testing revenue recognized for a sample of product sales transactions by obtaining and inspecting source documents, such as purchase orders, invoices, proof of shipment or delivery, and cash receipts, where applicable, and (ii) confirming a sample of outstanding customer invoice balances as of December 31, 2025 and, for confirmations not returned, obtaining and inspecting source documents, such as purchase orders, invoices, proof of shipment or delivery, and subsequent cash receipts, where applicable.
F-2
/s/ PricewaterhouseCoopers LLP
February 26, 2026
We have served as the Company’s auditor since 2024.
F-3
Qnity Electronics, Inc.
Consolidated Statements of Operations
| (In millions, except for per share amounts) For the years ended December 31, | 2025 | 2024 | 2023 | ||||||||
| Net sales | $ | $ | $ | ||||||||
| Cost of sales | |||||||||||
| Research and development expenses | |||||||||||
| Selling, general and administrative expenses | |||||||||||
| Amortization of intangibles | |||||||||||
| Restructuring and asset related charges - net | |||||||||||
| Acquisition, integration and separation costs | |||||||||||
| Equity in earnings of nonconsolidated affiliates | |||||||||||
| Interest expense | |||||||||||
| Other income (expense) - net | |||||||||||
| Income before income taxes | $ | $ | $ | ||||||||
| Provision for income taxes | |||||||||||
| Net income | $ | $ | $ | ||||||||
| Net income attributable to noncontrolling interests | |||||||||||
| Net income available for Qnity common stockholders | $ | $ | $ | ||||||||
| Per common share data: | |||||||||||
| Earnings per common share - basic | $ | $ | $ | ||||||||
| Earnings per common share - diluted | $ | $ | $ | ||||||||
| Weighted-average common shares outstanding - basic | |||||||||||
| Weighted-average common shares outstanding - diluted | |||||||||||
See Notes to the Consolidated Financial Statements.
F-4
Qnity Electronics, Inc.
Consolidated Statements of Comprehensive Income
| (In millions) For the years ended December 31, | 2025 | 2024 | 2023 | ||||||||
| Net income | $ | $ | $ | ||||||||
| Other comprehensive income (loss), net of tax | |||||||||||
| Cumulative translation adjustments | ( | ( | |||||||||
| Pension and other post-employment benefit plans | ( | ( | |||||||||
| Total other comprehensive income (loss) | $ | $ | ( | $ | ( | ||||||
| Comprehensive income | $ | $ | $ | ||||||||
| Comprehensive income attributable to noncontrolling interests, net of tax | |||||||||||
| Comprehensive income attributable to Qnity | $ | $ | $ | ||||||||
See Notes to the Consolidated Financial Statements.
F-5
Qnity Electronics, Inc.
Consolidated Balance Sheets
| (In millions, except share and par value amounts) | December 31, 2025 | December 31, 2024 | ||||||
| Assets | ||||||||
| Current Assets | ||||||||
Cash and cash equivalents | $ | $ | ||||||
| Accounts and notes receivable - net | ||||||||
| Inventories - net | ||||||||
| Prepaid and other current assets | ||||||||
Total current assets | $ | $ | ||||||
| Property | ||||||||
| Property, plant and equipment | ||||||||
| Less: Accumulated depreciation | ||||||||
| Property, plant and equipment - net | $ | $ | ||||||
| Other Assets | ||||||||
Goodwill | ||||||||
Other intangible assets | ||||||||
| Investments and noncurrent receivables | ||||||||
Deferred income tax assets | ||||||||
Deferred charges and other assets | ||||||||
Total other assets | $ | $ | ||||||
| Total Assets | $ | $ | ||||||
| Liabilities and Equity | ||||||||
| Current Liabilities | ||||||||
| Short-term borrowings | ||||||||
Accounts payable | ||||||||
Income taxes payable | ||||||||
Accrued and other current liabilities | ||||||||
Total current liabilities | $ | $ | ||||||
| Long-Term Debt | ||||||||
| Other Noncurrent Liabilities | ||||||||
Deferred income tax liabilities | ||||||||
| Pension and other post-employment benefits - noncurrent | ||||||||
Other noncurrent obligations | ||||||||
Total other noncurrent liabilities | $ | $ | ||||||
| Total Liabilities | $ | $ | ||||||
Commitments and contingent liabilities (Note 15) | ||||||||
| Stockholders' Equity | ||||||||
Common stock (authorized | ||||||||
Preferred stock (authorized | ||||||||
Additional paid-in capital | ||||||||
| Retained earnings | ||||||||
| Parent company net investment | ||||||||
| Accumulated other comprehensive loss | ( | ( | ||||||
| Total Qnity equity | $ | $ | ||||||
Noncontrolling interests | ||||||||
Total equity | $ | $ | ||||||
| Total Liabilities and Equity | $ | $ | ||||||
See Notes to the Consolidated Financial Statements.
F-6
Qnity Electronics, Inc.
Consolidated Statements of Cash Flows
| (In millions) For the years ended December 31, | 2025 | 2024 | 2023 | ||||||||
| Operating Activities | |||||||||||
| Net income | $ | $ | $ | ||||||||
| Adjustments to reconcile net income to net cash provided by operating activities: | |||||||||||
| Depreciation of property, plant and equipment | |||||||||||
| Amortization of definite-lived intangible assets | |||||||||||
| Stock-based compensation | |||||||||||
| Credit for deferred income tax and other tax related items | ( | ( | ( | ||||||||
| Net gain on sales of assets | ( | ( | ( | ||||||||
| Restructuring and asset related charges - net | |||||||||||
| Net periodic pension benefit cost | |||||||||||
| Periodic benefit plan contributions | ( | ( | ( | ||||||||
| Earnings of nonconsolidated affiliates less dividends received | ( | ||||||||||
| Changes in assets and liabilities: | |||||||||||
| Accounts and notes receivable | ( | ( | |||||||||
| Inventories | ( | ( | |||||||||
| Other assets | ( | ( | |||||||||
| Accounts payable | ( | ||||||||||
| Accrued and other current liabilities | ( | ||||||||||
| Other noncurrent liabilities | ( | ||||||||||
| Income tax liabilities | ( | ||||||||||
| Cash provided by operating activities | $ | $ | $ | ||||||||
| Investing Activities | |||||||||||
| Capital expenditures | ( | ( | ( | ||||||||
| Proceeds from sales of property and other assets | |||||||||||
| Other investing activities, net | |||||||||||
| Cash used for investing activities | $ | ( | $ | ( | $ | ( | |||||
| Financing Activities | |||||||||||
| Proceeds from issuance of Company stock | |||||||||||
| Proceeds from issuance of Preferred stock | |||||||||||
| Distributions to noncontrolling interests | ( | ( | ( | ||||||||
| Dividends paid to stockholders | ( | ||||||||||
| Net transfers to Parent | ( | ( | ( | ||||||||
| Proceeds from issuance of long-term debt | |||||||||||
| Payments for debt issuance costs | ( | ||||||||||
| Cash used for financing activities | $ | ( | $ | ( | $ | ( | |||||
| Effect of exchange rate changes on cash and cash equivalents | ( | ( | |||||||||
| Increase in cash and cash equivalents | $ | $ | $ | ||||||||
| Cash and cash equivalents at beginning of the period | $ | $ | $ | ||||||||
| Cash and cash equivalents at end of period | $ | $ | $ | ||||||||
| (In millions) For the years ended December 31, | 2025 | 2024 | 2023 | ||||||||
| Supplemental cash flow information | |||||||||||
| Cash paid during the year for: | |||||||||||
| Interest, net of amounts capitalized | $ | $ | $ | ||||||||
| Income taxes, net of refunds | $ | $ | $ | ||||||||
See Notes to the Consolidated Financial Statements.
F-7
Qnity Electronics, Inc.
Consolidated Statements of Equity
| In millions | Common Stock | Preferred Stock | Additional Paid-in Capital | Retained Earnings | Parent Company Net Investment | Accumulated Other Comp (Loss) Income | Non-controlling Interests | Total Equity | ||||||||||||||||||
| 2023 | ||||||||||||||||||||||||||
| Balance at January 1, 2023 | $ | $ | $ | $ | $ | $ | ( | $ | $ | |||||||||||||||||
Net income | — | — | — | — | — | |||||||||||||||||||||
| Other comprehensive loss | — | — | — | — | — | ( | ( | ( | ||||||||||||||||||
| Distributions to noncontrolling interests | — | — | — | — | — | — | ( | ( | ||||||||||||||||||
| Net transfers to Parent | — | — | — | — | ( | — | — | ( | ||||||||||||||||||
| Balance at December 31, 2023 | $ | $ | $ | $ | $ | $ | ( | $ | $ | |||||||||||||||||
| 2024 | ||||||||||||||||||||||||||
Net income | — | — | — | — | — | |||||||||||||||||||||
| Other comprehensive loss | — | — | — | — | — | ( | ( | ( | ||||||||||||||||||
| Distributions to noncontrolling interests | — | — | — | — | — | — | ( | ( | ||||||||||||||||||
| Net transfers to Parent | — | — | — | — | ( | — | — | ( | ||||||||||||||||||
| Balance at December 31, 2024 | $ | $ | $ | $ | $ | $ | ( | $ | $ | |||||||||||||||||
| 2025 | ||||||||||||||||||||||||||
Net income | — | — | — | — | ||||||||||||||||||||||
Other comprehensive income | — | — | — | — | — | |||||||||||||||||||||
Dividends ($ | — | — | — | ( | — | — | — | ( | ||||||||||||||||||
| Stock-based compensation | — | — | — | — | — | — | ||||||||||||||||||||
| Distributions to noncontrolling interests | — | — | — | — | — | — | ( | ( | ||||||||||||||||||
| Net transfers to Parent | — | — | — | — | ( | — | — | ( | ||||||||||||||||||
| Initial capitalization of Qnity, Inc. from Parent Company Net Investment | — | ( | — | — | ||||||||||||||||||||||
| Separation-related adjustments | — | — | ( | — | — | ( | — | ( | ||||||||||||||||||
Other | — | — | — | — | — | |||||||||||||||||||||
| Balance at December 31, 2025 | $ | $ | $ | $ | $ | $ | ( | $ | $ | |||||||||||||||||
F-8
Qnity Electronics, Inc.
NOTES TO THE CONSOLIDATED FINANCIAL STATEMENTS
Table of Contents
| Note | Page | |||||||
| 1 | F-10 | |||||||
| 2 | F-15 | |||||||
| 3 | F-16 | |||||||
| 4 | F-18 | |||||||
| 5 | F-19 | |||||||
| 6 | F-20 | |||||||
| 7 | F-21 | |||||||
| 8 | F-25 | |||||||
| 9 | F-25 | |||||||
| 10 | F-25 | |||||||
| 11 | F-26 | |||||||
| 12 | F-26 | |||||||
| 13 | F-26 | |||||||
| 14 | F-28 | |||||||
| 15 | F-30 | |||||||
| 16 | F-32 | |||||||
| 17 | F-33 | |||||||
| 18 | F-34 | |||||||
| 19 | F-39 | |||||||
| 20 | F-41 | |||||||
| 21 | F-42 | |||||||
| 22 | F-43 | |||||||
| 23 | F-46 | |||||||
F-9
NOTE 1 - BACKGROUND AND SIGNIFICANT ACCOUNTING POLICIES
Qnity's Spin -Off
On May 22, 2024, DuPont announced its plan to separate Qnity from DuPont into an independent publicly traded company (the “Separation”). On November 1, 2025 (the "Separation and Distribution Date"), DuPont completed the Separation through a pro-rata distribution of one share of Qnity common stock for every two shares of DuPont common stock held at the close of business on the record date of October 22, 2025 (the "Distribution"). As a result of the Distribution, as of the Separation and Distribution Date, Qnity became an independent, publicly traded company, and Qnity common stock commenced trading on the New York Stock Exchange under the symbol "Q" at the start of trading on November 3, 2025.
Principles of Consolidation
The accompanying Consolidated Financial Statements of Qnity Electronics, Inc. ("Qnity” or the "Company”) were prepared in accordance with accounting principles generally accepted in the United States of America (“U.S. GAAP”). The significant accounting policies described below, together with the other notes that follow, are an integral part of the Consolidated Financial Statements.
Basis of Presentation
The annual periods ending December 31, 2024, and 2023 and the period from January 1 through November 1, 2025 (the “pre-Separation periods”) reflect allocations of certain DuPont corporate, infrastructure and shared services expenses using a variety of allocation methodologies that are appropriate for the type of allocated expense. Where possible, these charges were allocated based on direct usage, with the remainder allocated on a pro rata basis of headcount, gross profit, asset or other allocation methodologies that are considered to be a reasonable reflection of the utilization of services provided or the benefit received by Qnity during the periods presented.
Cash and cash equivalents held by DuPont at the corporate level during the pre-Separation periods were not attributable to the Company for any of the periods presented due to DuPont’s centralized approach to cash management and the financing of its operations. Only cash amounts specifically held by Qnity are reflected in the Consolidated Balance Sheet. DuPont’s debt was not attributed to the Company for any of the periods presented because DuPont’s borrowings are not the legal obligation of Qnity. The only third-party debt obligations included in the Consolidated Financial Statements are those for which the legal obligor is a legal entity of Qnity. Interest expense associated with DuPont's debt was not attributed to the Company for any of the periods presented as Qnity is not the legal obligor of DuPont's third-party debt. The interest expense included in the Consolidated Financial Statements is the amount which relates to third-party debt obligations for which the legal obligor is a legal entity of Qnity.
Transfers of cash, both to and from DuPont’s centralized cash management system prior to Separation, are reflected as a component of Net Parent investment in the Consolidated Balance Sheet and as financing activities in the accompanying Consolidated Statement of Cash Flows. In addition, Net Parent investment in the Consolidated Balance Sheet represents the accumulation of the Company’s net income (loss) over time and net non-trade intercompany transactions between Qnity and DuPont (for example, investments from DuPont or distributions to DuPont).
As a result of the allocations and carve-out methodologies used to prepare the Consolidated Financial Statements for the pre-Separation periods, the results may not be indicative of the Company’s future performance, and may not reflect the results of operations, financial position and cash flows Qnity would have achieved if it had been a separate, standalone company during the pre-Separation periods.
The income tax provisions included in these Consolidated Financial Statements for the pre-Separation periods were calculated using the separate return basis, as if Qnity filed separate tax returns. The calculation of income taxes on a hypothetical separate return basis requires a considerable amount of judgment and use of both estimates and allocations; pre-Separation current and deferred taxes may not be reflective of the actual tax balances subsequent to the Separation. Current income tax liabilities including amounts for unrecognized tax benefits related to Qnity’s activities included in the Parent’s income tax returns were assumed to be immediately settled with Parent through the Net Parent investment account in the Consolidated Balance Sheet and reflected in Net transfers to Parent in the Consolidated Statement of Cash Flows during these periods.
F-10
Use of Estimates in Financial Statement Preparation
Cash and Cash Equivalents
Fair Value Measurements
Under the accounting guidance for fair value measurements and disclosures, a fair value hierarchy was established that prioritizes the inputs to valuation techniques used to measure fair value. The hierarchy gives the highest priority to unadjusted quoted prices in active markets for identical assets or liabilities (Level 1 measurements) and the lowest priority to unobservable inputs (Level 3 measurements). A financial instrument's level within the fair value hierarchy is based on the lowest level of any input that is significant to the fair value measurement.
The Company uses the following valuation techniques to measure fair value for its assets and liabilities:
| Level 1 | – | Quoted market prices in active markets for identical assets or liabilities; | ||||||
| Level 2 | – | Significant other observable inputs (e.g. quoted prices for similar items in active markets, quoted prices for identical or similar items in markets that are not active, inputs other than quoted prices that are observable such as interest rate and yield curves, and market-corroborated inputs); | ||||||
| Level 3 | – | Unobservable inputs for the asset or liability, which are valued based on management's estimates of assumptions that market participants would use in pricing the asset or liability. | ||||||
Foreign Currency Translation
The Company's worldwide operations utilize the U.S. dollar ("USD") or local currency as the functional currency, where applicable. The Company identifies its separate and distinct foreign entities and groups the foreign entities into two categories: 1) extension of the parent or foreign subsidiaries operating in a hyper-inflationary environment (USD functional currency) and 2) self-contained (local functional currency). If a foreign entity does not align with either category, factors are evaluated and a judgment is made to determine the functional currency.
For foreign entities where the USD is the functional currency, all foreign currency-denominated asset and liability amounts are re-measured into USD at end-of-period exchange rates, except for inventories, prepaid expenses, property, plant and equipment, goodwill, other intangible assets and other non-monetary items, which are re-measured at historical rates. Foreign currency income and expenses are re-measured at average exchange rates in effect during the year, except for expenses related to balance sheet amounts re-measured at historical exchange rates. Exchange gains and losses arising from re-measurement of foreign currency-denominated monetary assets and liabilities are included in income in the period in which they occur.
For foreign entities where the local currency is the functional currency, assets and liabilities denominated in local currencies are translated into USD at end-of-period exchange rates and the resultant translation adjustments are reported, net of their related tax effects, as a component of accumulated other comprehensive income (loss) in equity. Assets and liabilities denominated in other than the local currency are re-measured into the local currency prior to translation into USD and the resultant exchange gains or losses are included in income in the period in which they occur. Income and expenses are translated into USD at average exchange rates in effect during the period.
The Company changes the functional currency of its separate and distinct foreign entities only when significant changes in economic facts and circumstances indicate clearly that the functional currency has changed.
F-11
Inventories
The Company's inventories are valued at the lower of cost or net realizable value. Elements of cost in inventories include raw materials, direct labor and manufacturing overhead. Supplies are valued at cost or net realizable value, whichever is lower; cost is determined by the average cost method. The Company establishes allowances for obsolescence of inventory based upon quality considerations and assumptions about future demand and market conditions.
In periods of abnormally low production, certain fixed costs normally absorbed into inventory are recorded directly to cost of sales in the period incurred.
Property, Plant and Equipment
Property, plant and equipment are carried at cost less accumulated depreciation. Depreciation is based on the estimated service lives of depreciable assets and is calculated using the straight-line method. Fully depreciated assets are retained in property and accumulated depreciation accounts until they are removed from service. When assets are surrendered, retired, sold, or otherwise disposed of, their gross carrying values and related accumulated depreciation are removed from the Consolidated Balance Sheets and included in determining gain or loss on such disposals.
Goodwill and Other Intangible Assets
The Company records goodwill when the purchase price of a business acquisition exceeds the estimated fair value of net identified tangible and intangible assets acquired. Goodwill is tested for impairment at the reporting unit level annually during the fourth quarter, or more frequently when events or changes in circumstances indicate that the fair value of a reporting unit has more likely than not declined below its carrying value.
When testing goodwill for impairment, the Company has the option to first perform qualitative testing to determine whether it is more likely than not that the fair value of a reporting unit is less than its carrying value. If the Company chooses not to complete a qualitative assessment for a given reporting unit or if the initial assessment indicates that it is more likely than not that the carrying value of a reporting unit exceeds its estimated fair value, additional quantitative testing is required. If the carrying value of a reporting unit exceeds its fair value, an impairment loss is recognized in the amount by which the carrying value of the reporting unit exceeds its fair value, limited to the amount of goodwill at the reporting unit. The Company determines fair values for each of the reporting units using a combination of the income approach and market approach. Under the income approach, fair value is determined based on the net present value of estimated future cash flows, discounted at an appropriate risk-adjusted rate. Under the market approach, the Company selects peer sets based on close competitors and reviews the EBITDA multiples to determine the fair value. When applicable, third-party purchase offers may be utilized to measure fair value. The Company applies a weighting to the market approach and income approach to determine the fair value. See Note 13 for further information on goodwill.
Impairment and Disposals of Long-Lived Assets
The Company evaluates the carrying value of long-lived assets to be held and used when events or changes in circumstances indicate the carrying value may not be recoverable. The carrying value of a long-lived asset group is considered for impairment when the total projected undiscounted cash flows from the assets are separately identifiable and are less than its carrying value. In that event, a loss would be recognized based on the amount by which the carrying value exceeds the fair value of the long-lived asset group. The Company's fair value methodology is an estimate of fair market value which is made based on prices of similar assets or other valuation methodologies, including present value techniques. Long-lived assets to be disposed of by sale, if material, are classified as held for sale and reported at the lower of carrying amount or fair value less cost to sell, and depreciation is ceased. Long-lived assets to be disposed of other than by sale are classified as held and used until they are disposed. Depreciation is recognized over the remaining useful life of the assets.
F-12
Acquisitions
In accordance with ASC 805, Business Combinations, acquisitions are recorded using the acquisition method of accounting. The Company includes the operating results of acquired entities from their respective dates of acquisition. The Company recognizes and measures the identifiable assets acquired and liabilities assumed as of the acquisition date fair value, where applicable. The excess, if any, of total consideration transferred in a business combination over the fair value of identifiable assets acquired and liabilities assumed is recognized as goodwill. Costs incurred as a result of a business combination other than costs related to the issuance of debt or equity securities are recorded in the period the costs are incurred.
Leases
The Company determines whether an arrangement is a lease at the inception of the arrangement based on the terms and conditions in the contract, in accordance with ASC 842, Leases. A contract contains a lease if there is an identified asset and the Company has the right to control the asset. Operating lease right-of-use ("ROU") assets are included in "Deferred charges and other assets" on the Consolidated Balance Sheets. Operating lease liabilities are included in "Accrued and other current liabilities" and "Other noncurrent obligations" on the Consolidated Balance Sheets. Finance lease ROU assets are included in "Property, plant and equipment - net" and the corresponding lease liabilities are included in "Long-term debt" or "Short-term borrowings" on the Consolidated Balance Sheets.
ROU assets represent the Company’s right to use an underlying asset for the lease term and lease liabilities represent the Company’s obligation to make lease payments arising from the lease. Operating lease ROU assets and liabilities are recognized at the commencement date based on the present value of lease payments over the lease term. As most of the Company’s leases do not provide the lessor's implicit rate, the Company uses its incremental borrowing rate at the commencement date in determining the present value of lease payments. Lease terms include options to extend the lease when it is reasonably certain those options will be exercised. Leases with an initial term of 12 months or less are not recorded on the balance sheet.
The Company has lease agreements with lease and non-lease components, which are accounted for as a single lease component for all asset classes. Additionally, for certain equipment leases, the portfolio approach is applied to account for the operating lease ROU assets and lease liabilities. In the Consolidated Statements of Operations, lease expense for operating lease payments is recognized on a straight-line basis over the lease term. For finance leases, interest expense is recognized on the lease liability and the ROU asset is amortized over the lease term.
Debt Issuance Costs
Long-Term Debt
Derivative Instruments
Derivative instruments are reported in the Consolidated Balance Sheets at their fair values. The Company utilizes derivatives to manage exposures to foreign currency exchange rates and commodity prices. Changes in the fair values of derivative instruments that are not designated as hedges are recorded in current period earnings. For derivative instruments designated as cash flow hedges, the gain or loss is reported in accumulated other comprehensive income (loss) ("AOCI") until it is cleared to earnings during the same period in which the hedged item affects earnings.
In the event that a derivative designated as a hedge of a firm commitment or an anticipated transaction is terminated prior to the maturation of the hedged transaction, the net gain or loss in AOCI generally remains in AOCI until the item that was hedged affects earnings. If a hedged transaction matures, or is sold, extinguished, or terminated prior to the maturity of a derivative designated as a hedge of such transaction, gains or losses associated with the derivative through the date the transaction matured are included in the measurement of the hedged transaction and the derivative is reclassified as for trading purposes. Derivatives designated as hedges of anticipated transactions are reclassified for trading purposes if the anticipated transaction is no longer probable.
F-13
For derivative instruments designated as net investment hedges, the gain or loss is reported as a component of Other comprehensive income (loss) and recorded in AOCI. The gain or loss will be subsequently reclassified into net earnings when the hedged net investment is either sold or substantially liquidated.
Indemnifications
Revenue Recognition
The Company recognizes revenue when its customer obtains control of promised goods or services, in an amount that reflects the consideration which the Company expects to receive in exchange for those goods or services. To determine revenue recognition for the arrangements that the Company determines are within the scope of Revenue from Contracts with Customers (Topic 606), the Company performs the following five steps: (1) identify the contract(s) with a customer, (2) identify the performance obligations in the contract, (3) determine the transaction price, (4) allocate the transaction price to the performance obligations in the contract, and (5) recognize revenue when (or as) the entity satisfies a performance obligation. See Note 3 for additional information on revenue recognition.
Cost of Sales
Research and Development
Research and development costs are expensed as incurred. Research and development expense includes costs (primarily consisting of employee costs, materials, contract services, research agreements, and other external spend) relating to the discovery and development of new products, and enhancement of existing products.
Selling, General and Administrative Expenses
Acquisition, Integration and Separation Costs
Litigation
Restructuring and Asset Related Charges
Charges for restructuring programs generally include targeted actions involving employee severance and related benefit costs, contract termination charges, and asset related charges, which include impairments or accelerated depreciation/amortization of long-lived assets associated with such actions. Employee severance and related benefit costs are provided to employees under the Company’s ongoing benefit arrangements. These charges are accrued during the period when management commits to a plan of termination and it becomes probable that employees will be entitled to benefits at amounts that can be reasonably estimated. Contract termination charges primarily reflect costs to terminate a contract before the end of its term or costs that will continue to be incurred under the contract for its remaining term without economic benefit to the Company. Asset related charges reflect impairments to long-lived assets and indefinite-lived intangible assets no longer deemed recoverable and depreciation/amortization of long-lived assets, which is accelerated over their remaining economic lives.
F-14
Income Taxes
The Company accounts for income taxes using the asset and liability method. Under this method, deferred tax assets and liabilities are recognized for the future tax consequences of temporary differences between the carrying amounts and tax bases of assets and liabilities using enacted tax rates. The effect of a change in tax rates on deferred tax assets or liabilities is recognized in income in the period that includes the enactment date.
The Company recognizes the financial statement effects of an uncertain income tax position when it is more likely than not, based on the technical merits, that the position will be sustained upon examination. The Company accrues for other tax contingencies, such as indemnifications, when it is probable that a liability to a taxing authority has been incurred and the amount of the contingency can be reasonably estimated. The current portion of uncertain income tax positions is included in "Income taxes payable" and the long-term portion is included in "Other noncurrent obligations" in the Consolidated Balance Sheets.
Stock-Based Compensation
The Company grants stock-based compensation awards that vest over a specified period or upon employees meeting certain performance and/or retirement eligibility criteria. The fair value of equity instruments issued to employees is measured on the grant date. The fair value of liability instruments issued to employees is measured at the end of each quarter. The fair value of equity and liability instruments is expensed over the vesting period or, in the case of retirement, from the grant date to the date on which retirement eligibility provisions have been met and additional service is no longer required. The Company estimates expected forfeitures based on historical forfeiture rates.
Preferred Stock
Certain items have been reclassified to conform to current period presentation.
NOTE 2 - RECENT ACCOUNTING GUIDANCE
Recently Adopted Accounting Guidance
In December 2023, the FASB issued Accounting Standards Update No. 2023-09, "Income Taxes (Topic 740): Improvements to Income Tax Disclosures" ("ASU 2023-09") to improve transparency and disclosure requirements for the rate reconciliation, income taxes paid and other tax disclosures. The amendments in ASU 2023-09 are effective for fiscal years beginning after December 15, 2024, on a prospective basis, with retrospective application being permitted. The Company implemented the new disclosures, on a prospective basis, as required for the year ended December 31, 2025. See Note 7 for more information.
Accounting Guidance Issued But Not Adopted at December 31, 2025
In November 2024, the FASB issued Accounting Standards Update No. 2024-03, "Income Statement: Reporting Comprehensive Income (Topic 220): Expense Disaggregation Disclosures" ("ASU 2024-03") to improve disclosures about the nature of expenses within line items on the statements of operations. The amendments in ASU 2024-03 are effective for the Company's 2027 annual report and subsequent interim periods; however, early adoption is permitted. The amendments can be applied prospectively or retrospectively to all periods presented. The Company is currently evaluating the impact of adopting this guidance.
In September 2025, the FASB issued Accounting Standards Update No. 2025-06, “Intangibles—Goodwill and Other—Internal-Use Software (Subtopic 350-40): Targeted Improvements to the Accounting for Internal-Use Software” (“ASU 2025-06”) to modernize the accounting for internal-use software costs and improve operability of the guidance across different software development project stages. The amendments in ASU 2025-06 are effective for the Company’s 2028 annual and quarterly reports; however, early adoption is permitted. The amendments can be applied prospectively, retrospectively, or using a modified transition approach. The Company is currently evaluating the impact of adopting this guidance.
F-15
In December 2025, the FASB issued Accounting Standards Update No. 2025-10, “Government Grants (Topic 832) - Accounting for Government Grants Received by Business Entities” (“ASU 2025-10”) to establish the accounting for a government grant received by a business entity, including guidance for grants related to assets and income. The amendments in ASU 2025-10 are effective for the Company’s 2029 annual and quarterly reports; however, early adoption is permitted. The amendments can be applied via a modified prospective, modified retrospective, or standard retrospective approach. The Company is currently evaluating the impact of adopting this guidance.
NOTE 3 - REVENUE
Revenue Recognition
Products
Substantially all of Qnity's revenue is derived from product sales. Product sales consist of sales of Qnity's products to supply manufacturers and distributors. Qnity considers purchase orders, which in some cases are governed by master supply agreements, to be a contract with a customer. Contracts with customers are considered to be short-term when the time between order confirmation and satisfaction of the performance obligations is equal to or less than one year.
Net sales to Samsung Electronics Co., Ltd accounted for 11 %, 12 %, and 12 % of total net sales for each of the years ended December 31, 2025, 2024 and 2023, respectively. Additionally, net sales to Taiwan Semiconductor Manufacturing Company Limited (TSMC) accounted for 8 %, 7 %, and 6 % of total net sales for the years ended December 31, 2025, 2024 and 2023, respectively. The majority of revenues for both customers relate to the Semiconductor Technologies segment. See Note 22 for more information.
F-16
Disaggregation of Revenue
The Company disaggregates its revenue from contracts with customers by segment and geographic region, as the Company believes it best depicts the nature, amount, timing and uncertainty of its revenue and cash flows. Sales are attributed to geographic regions based on customer location.
| Net Sales by Segment | For the Year Ended December 31, | ||||||||||
| In millions | 2025 | 2024 | 2023 | ||||||||
| Semiconductor Technologies | $ | $ | $ | ||||||||
| Interconnect Solutions | |||||||||||
| Total | $ | $ | $ | ||||||||
| Net Sales by Segment by Geographic Region | For the Year Ended December 31, | ||||||||||
| 2025 | |||||||||||
| Semiconductor Technologies | Interconnect Solutions | Total | |||||||||
| In millions | |||||||||||
| Americas: | $ | $ | $ | ||||||||
| United States | |||||||||||
Other Americas 1 | |||||||||||
EMEA 2 | |||||||||||
| Asia Pacific: | |||||||||||
| China | |||||||||||
| Rest of Asia Pacific: | |||||||||||
| South Korea | |||||||||||
| Taiwan | |||||||||||
| Other | |||||||||||
| Total | $ | $ | $ | ||||||||
| Net Sales by Segment by Geographic Region | For the Year Ended December 31, | ||||||||||
| 2024 | |||||||||||
| Semiconductor Technologies | Interconnect Solutions | Total | |||||||||
| In millions | |||||||||||
| Americas: | $ | $ | $ | ||||||||
| United States | |||||||||||
Other Americas 1 | |||||||||||
EMEA 2 | |||||||||||
| Asia Pacific: | |||||||||||
| China | |||||||||||
| Rest of Asia Pacific: | |||||||||||
| South Korea | |||||||||||
| Taiwan | |||||||||||
| Other | |||||||||||
| Total | $ | $ | $ | ||||||||
F-17
| Net Sales by Segment by Geographic Region | For the Year Ended December 31, | ||||||||||
| 2023 | |||||||||||
| Semiconductor Technologies | Interconnect Solutions | Total | |||||||||
| In millions | |||||||||||
| Americas: | $ | $ | $ | ||||||||
| United States | |||||||||||
Other Americas 1 | |||||||||||
EMEA 2 | |||||||||||
| Asia Pacific: | |||||||||||
| China | |||||||||||
| Rest of Asia Pacific: | |||||||||||
| South Korea | |||||||||||
| Taiwan | |||||||||||
| Other | |||||||||||
| Total | $ | $ | $ | ||||||||
1.Includes Canada and Latin America.
2.Europe, Middle East and Africa.
Contract Balances
From time to time, the Company enters into arrangements in which it receives payments from customers based upon contractual billing schedules. The Company records accounts receivables when the right to consideration becomes unconditional. Contract liabilities primarily reflect deferred revenue from advance payment for product that the Company has received from customers. The Company classifies deferred revenue as current or noncurrent based on the timing of when the Company expects to recognize revenue.
Revenue recognized for the years ended December 31, 2025 and 2024 from amounts included in contract liabilities at the beginning of the period was insignificant. The Company did not recognize any asset impairment charges related to contract assets during the period. The Company will begin recognizing its deferred revenue when the project associated with the revenue that was deferred is completed and commercial production begins, currently expected in 2027.
| Contract Balances | December 31, 2025 | December 31, 2024 | ||||||
| In millions | ||||||||
Accounts receivable - trade 1 | $ | $ | ||||||
Deferred revenue - current 2 | $ | $ | ||||||
Deferred revenue - non-current 3 | $ | $ | ||||||
1.Included in "Accounts and notes receivable - net" in the Consolidated Balance Sheets.
2.Included in "Accrued and other current liabilities" in the Consolidated Balance Sheets.
3.Included in "Other noncurrent obligations" in the Consolidated Balance Sheets.
NOTE 4 - RESTRUCTURING AND ASSET RELATED CHARGES - NET
F-18
NOTE 5 - RELATIONSHIP WITH DUPONT
On the Separation and Distribution Date, Qnity became an independent publicly traded company and DuPont ceased to be a related party on that date. In connection with the Separation, we and/or certain of our subsidiaries entered into several agreements with DuPont and/or certain of its subsidiaries as of the Separation and Distribution Date. These agreements included, but were not limited to, the following:
•Separation and Distribution Agreement (the "Separation and Distribution Agreement") - This agreement establishes the principal terms of the Separation, including the transfer of assets and liabilities, the mechanics of the distribution, and the overall framework for the ongoing relationship between the Company and DuPont.
•Tax Matters Agreement - This agreement allocates responsibility between the parties for taxes attributable to periods before and after the Separation and governs the administration of tax matters, tax filings, audits, and related indemnification obligations.
•Employee Matters Agreement - This agreement sets forth the allocation of employees and employee‑related liabilities between the parties and addresses matters relating to compensation, benefits, incentive plans, and post‑Separation employee transitions.
•Transition Services Agreements - This agreement provides for certain transitional support services to be supplied by one party to the other for a limited period following the Separation to ensure operational continuity, including services such as information technology, human resources, finance, and other shared functions.
•ESL Cost Sharing Agreement - This agreement establishes the framework for allocating and sharing costs associated with the Experimental Station facility (the "Experimental Station") by the Company and DuPont following the Separation.
•Other agreements governing aspects of the Company’s relationship with DuPont following the Separation including the Intellectual Property Cross-License Agreement and Legacy Liabilities Assignment Agreement, among others.
Prior to Separation, Qnity had been managed and operated in the normal course with other businesses of DuPont. Accordingly, certain shared costs had been allocated to Qnity and reflected as expenses in the stand-alone Consolidated Financial Statements. Management considers the allocation methodologies used to be reasonable and appropriate reflections of the pre-Separation expenses attributable to Qnity for purposes of the stand-alone financial statements. The expenses reflected in the Consolidated Financial Statements may not be indicative of expenses that will be incurred by Qnity in the future. All transactions with DuPont approximate prices at cost.
Corporate Expense Allocations
Qnity’s Consolidated Statements of Operations include general corporate expenses of DuPont for services provided by DuPont for certain support functions that were provided on a centralized basis prior to Separation. These costs were allocated using relevant allocation methods, primarily based on sales metrics.
Corporate expense allocations prior to Separation were recorded in the Consolidated Statements of Operations within the following captions:
| In millions | For the Year Ended December 31, | ||||||||||
| 2025 | 2024 | 2023 | |||||||||
| Selling, general and administrative expenses | $ | $ | $ | ||||||||
| Cost of sales | |||||||||||
| Research and development expenses | |||||||||||
| Acquisition, integration and separation costs | |||||||||||
| Restructuring | |||||||||||
| Total corporate expense allocations | $ | $ | $ | ||||||||
F-19
Parent Company Equity
Net transfers to Parent are included within Parent company net investment on the Consolidated Statements of Changes in Equity. The components of the net transfers to Parent are as follows:
| In millions | For the Year Ended December 31, | ||||||||||
| 2025 | 2024 | 2023 | |||||||||
| Cash pooling and general financing activities | $ | ( | $ | ( | $ | ( | |||||
| Less: Corporate cost allocations | |||||||||||
| Less: Taxes deemed settled with Parent | |||||||||||
| Total net transfers to Parent per Consolidated Statements of Changes in Equity | $ | ( | $ | ( | $ | ( | |||||
| Stock-based compensation | ( | ( | ( | ||||||||
Other1 | |||||||||||
| Net transfers to Parent per Consolidated Statements of Cash Flows | $ | ( | $ | ( | $ | ( | |||||
NOTE 6 - SUPPLEMENTARY INFORMATION
| Other Income (Expense) - Net | |||||||||||
| (In millions) For the years ended December 31, | 2025 | 2024 | 2023 | ||||||||
| Net gain on sales of assets | $ | $ | $ | ||||||||
| Non-operating pension credits (costs) | ( | ||||||||||
| Interest income | |||||||||||
| Foreign exchange (losses) gains, net | ( | ( | |||||||||
| Indirect legacy benefits (costs), net | |||||||||||
| Miscellaneous income - net | |||||||||||
| Other income (expense) - net | $ | $ | $ | ||||||||
Accrued and Other Current Liabilities
| In millions | December 31, 2025 | December 31, 2024 | ||||||
| Accrued payroll | $ | $ | ||||||
Current indemnification liabilities 1 | ||||||||
Other 2 | ||||||||
| Total accrued and other current liabilities | $ | $ | ||||||
1. Related to current portion of indemnification liabilities, primarily to DuPont. For additional information on these matters, refer to Note 5.
2.No other component of “Accrued and other current liabilities” was more than 5% of total current liabilities at December 31, 2025 and 2024
F-20
NOTE 7 - INCOME TAXES
The Company operated as part of DuPont until completion of the spin off on November 1, 2025. Therefore, prior to that date, Qnity did not file separate tax returns in the U.S. federal, certain state and local, and certain foreign tax jurisdictions, as Qnity was included in the tax grouping of DuPont and its affiliate entities within the respective jurisdictions. The Company will file a separate tax return in these jurisdictions for the remainder of fiscal year 2025. The Company expects to file income tax returns on a standalone basis in most other foreign jurisdictions in which it operates for the full fiscal year 2025. Provision for income taxes included in these Consolidated Financial Statements have been calculated using the separate return basis, as if Qnity filed separate tax returns for the entirety of each of the periods presented. Prior to the spin off, the Company’s operations were calculated on a carve-out basis. Qnity’s Provision for income taxes as presented in the Consolidated Financial Statements may not be indicative of the income taxes that Qnity will generate in the future.
| Geographic Allocation of Income (Loss) and Provision for Income Taxes | 2025 | 2024 | 2023 | ||||||||
| (In millions) For the years ended December 31, | |||||||||||
| Income (loss) before income taxes | |||||||||||
| Domestic | $ | ( | $ | ( | $ | ( | |||||
| Foreign | |||||||||||
| Income before income taxes | $ | $ | $ | ||||||||
| Current tax expense | |||||||||||
| Federal | $ | $ | $ | ||||||||
| State and local | |||||||||||
| Foreign | |||||||||||
| Total current tax expense | $ | $ | $ | ||||||||
| Deferred tax benefit | |||||||||||
| Federal | $ | ( | $ | ( | $ | ( | |||||
| State and local | ( | ( | ( | ||||||||
| Foreign | ( | ( | ( | ||||||||
| Total deferred tax benefit | $ | ( | $ | ( | $ | ( | |||||
| Provision for income taxes | |||||||||||
| Net income | $ | $ | $ | ||||||||
F-21
| Reconciliation to U.S. Statutory Rate | 2025 | |||||||
| (In millions) For the year ended December 31, | Amount | Rate | ||||||
| U.S. Federal Statutory Tax Rate | $ | % | ||||||
State and Local Income Taxes, Net of Federal Income Tax Effect1 | ( | ( | ||||||
| Foreign Tax Effects | ||||||||
| China | ||||||||
| Statutory tax rate difference between China and United States | ||||||||
| Investment based benefits | ( | ( | ||||||
| Withholding tax | ||||||||
| Other | ( | ( | ||||||
| Japan | ||||||||
| Statutory tax rate difference between Japan and United States | ||||||||
| Other | ( | ( | ||||||
| Singapore | ||||||||
| Statutory tax rate difference between Singapore and United States | ( | ( | ||||||
| Investment based benefits | ( | ( | ||||||
| Qualified domestic minimum top up tax | ||||||||
| Other | ||||||||
| Other Foreign Jurisdictions | ||||||||
| Effects of Cross-Border Tax Laws | ( | ( | ||||||
| Tax Credits | ( | ( | ||||||
| Changes in Valuation Allowances | ||||||||
| Nontaxable or Nondeductible Items | ||||||||
| Changes in Unrecognized Tax Benefits | ||||||||
| Other Adjustments | ( | ( | ||||||
| Effective Tax Rate | $ | % | ||||||
1.State taxes in California and Massachusetts made up the majority (greater than 50 percent) of the tax effect in this category.
| Reconciliation to U.S. Statutory Rate | 2024 | 2023 | ||||||
| For the years ended December 31, | ||||||||
| Statutory U.S. federal income tax rate | % | % | ||||||
| Equity earning effect | ( | ( | ||||||
Foreign income taxed at rates other than the statutory U.S. federal income tax rate2 | ( | ( | ||||||
| U.S. tax effect of foreign earnings and dividends | ||||||||
| Unrecognized tax benefits | ( | |||||||
| State and local income taxes, net of federal income tax effect | ( | ( | ||||||
| Change in valuation allowance | ||||||||
| Tax credits | ( | ( | ||||||
| Foreign-derived intangible income (FDII) | ( | |||||||
| Other - net | ( | |||||||
| Effective tax rate | % | % | ||||||
2. Includes an expense of $36 million in connection with the settlement of an international tax audit for the year ended December 31, 2024.
F-22
Cash paid for income taxes (net of refunds) 1 | 2025 | ||||
| (In millions) For the year ended December 31, | |||||
| Federal | $ | ||||
| State and local | |||||
| Foreign | |||||
| Japan | |||||
| South Korea | |||||
| China | |||||
| Taiwan | |||||
| Czech Republic | |||||
| Other foreign | |||||
| Total foreign | |||||
Total cash paid for income taxes (net of refunds)1 | $ | ||||
| Deferred Tax Balances at December 31, | 2025 | 2024 | ||||||
| (In millions) | ||||||||
| Deferred tax assets: | ||||||||
| Lease liability | $ | $ | ||||||
| Research and development | ||||||||
| Tax losses and credit carryforwards | ||||||||
| Goodwill | ||||||||
| Pension and postretirement benefit obligations | ||||||||
| Inventory | ||||||||
| Other accruals and reserves | ||||||||
| Other - net | ||||||||
| Gross deferred tax assets | $ | $ | ||||||
Valuation allowances 1 | ( | ( | ||||||
| Total deferred tax assets | $ | $ | ||||||
| Deferred tax liabilities: | ||||||||
| Intangibles | ( | ( | ||||||
| Property | ( | ( | ||||||
| Operating lease assets | ( | ( | ||||||
| Investments | ( | ( | ||||||
| Total deferred tax liabilities | $ | ( | $ | ( | ||||
| Total net deferred tax liability | $ | ( | $ | ( | ||||
1.Primarily related to recorded tax benefits and the non-realizability of tax losses and credit carryforwards from operations in the United States, Europe, and Asia Pacific.
| Operating Loss and Tax Credit Carryforwards | Deferred Tax Asset | |||||||
| (In millions) As of December 31, | 2025 | 2024 | ||||||
| Operating loss carryforwards | ||||||||
| Expire within 5 years | $ | $ | ||||||
| Expire after 5 years or indefinite expiration | ||||||||
| Total operating loss carryforwards | $ | $ | ||||||
| Tax credit carryforwards | ||||||||
| Expire within 5 years | $ | $ | ||||||
| Expire after 5 years or indefinite expiration | ||||||||
| Total tax credit carryforwards | $ | $ | ||||||
| Total Operating Loss and Tax Credit Carryforwards | $ | $ | ||||||
F-23
| Total Gross Unrecognized Tax Benefits | 2025 | 2024 | 2023 | ||||||||
| (In millions), For the years ended December 31, | |||||||||||
| Total unrecognized tax benefits at January 1, | $ | $ | $ | ||||||||
| Decreases related to positions taken on items from prior years | ( | ( | |||||||||
| Increases related to positions taken on items from prior years | |||||||||||
| Increases related to positions taken in the current year | |||||||||||
| Settlement of uncertain tax positions with tax authorities | ( | ||||||||||
| Increases through equity due to spin-off | |||||||||||
Total unrecognized tax benefits at December 31, | $ | $ | $ | ||||||||
| Total unrecognized tax benefits that, if recognized, would impact the effective tax rate | $ | $ | $ | ||||||||
| Total amount of interest and penalties (benefit) recognized in "Provision for (benefit from) income taxes" | $ | $ | $ | ||||||||
| Total accrual for interest and penalties associated with unrecognized tax benefits | $ | $ | $ | ||||||||
Qnity files tax returns in the various national, state and local income taxing jurisdictions in which it operates, either as a separate taxpayer or as a member of DuPont’s consolidated income tax return in periods prior to the spin off. These tax returns are subject to examination and possible challenge by the tax authorities. Positions challenged by the tax authorities may be settled or appealed by Qnity. As a result, there is an uncertainty in income taxes recognized in Qnity’s financial statements in accordance with accounting for income taxes and accounting for uncertainty in income taxes. The ultimate resolution of such uncertainties is not expected to have a material impact on Qnity’s results of operations.
Tax years that remain subject to examination for Qnity’s major tax jurisdictions are shown below:
Tax Years Subject to Examination by Major Tax Jurisdiction at December 31, 2025 | Earliest Open Year | ||||
| Jurisdiction | |||||
| China | 2014 | ||||
| Japan | 2018 | ||||
| Korea | 2020 | ||||
| Singapore | 2019 | ||||
| Taiwan | 2019 | ||||
| United Kingdom | 2021 | ||||
| United States: | |||||
| Federal income tax | 2012 | ||||
| State and local income tax | 2011 | ||||
The Company has not recorded deferred tax liabilities with respect to undistributed earnings of foreign subsidiaries and related companies that are deemed to be permanently invested. In addition to the U.S. federal tax imposed by the Tax Cuts and Jobs Act (the “Act”) on all accumulated unrepatriated earnings through December 31, 2017, the Act introduced additional U.S. federal tax on foreign earnings, effective as of January 1, 2018. The undistributed foreign earnings at December 31, 2025 may still be subject to certain taxes upon repatriation, primarily where foreign withholding taxes apply. It is not practicable to calculate the unrecognized deferred tax liability on undistributed foreign earnings due to the complexity of the hypothetical calculation.
F-24
NOTE 8 - EARNINGS PER SHARE CALCULATIONS
On the Separation and Distribution Date, approximately 209 million shares of the Company's common stock, par value $0.01 per share, were distributed to DuPont shareholders of record as of October 22, 2025. This share amount is being utilized for the calculation of basic and diluted earnings per share for all periods presented prior to the Separation as all common stock was owned by DuPont prior to the Separation. For all periods presented prior to the Separation, it is assumed that there are no dilutive equity instruments as there were no equity awards of Qnity outstanding prior to the Separation. Therefore, the calculation of basic and diluted earnings per share is the same for those periods. Subsequent to Separation, actual basic share counts and diluted share counts were utilized for the calculation.
The following tables provide earnings per share calculations for the years ended December 31, 2025, 2024 and 2023:
Net Income for Earnings Per Share Calculations - Basic & Diluted In millions | 2025 | 2024 | 2023 | ||||||||
| Net income | $ | $ | $ | ||||||||
| Net income attributable to noncontrolling interests | |||||||||||
| Net income attributable to common stockholders | $ | $ | $ | ||||||||
| Earnings attributable to common stockholders - basic | $ | $ | $ | ||||||||
| Earnings attributable to common stockholders - diluted | $ | $ | $ | ||||||||
Share Count Information Shares in millions | 2025 | 2024 | 2023 | ||||||||
| Weighted-average common shares - basic | |||||||||||
| Plus dilutive effect of equity compensation plans | |||||||||||
| Weighted-average common shares - diluted | |||||||||||
Stock option, restricted stock units and performance-based restricted stock units excluded from EPS calculations1 | |||||||||||
1.These outstanding options to purchase shares of common stock, restricted stock units and performance based restricted stock units were excluded from the calculation of diluted earnings per share because the effect of including them would have been antidilutive.
NOTE 9 - ACCOUNTS AND NOTES RECEIVABLE - NET
Accounts receivable are carried at amounts that approximate fair value.
| In millions | December 31, 2025 | December 31, 2024 | ||||||
Accounts receivable – trade 1 | $ | $ | ||||||
Current indemnification assets 2 | ||||||||
Other 3 | ||||||||
| Total accounts and notes receivable - net | $ | $ | ||||||
1.Accounts receivable – trade is net of allowances of $2
2.Related to current portion of indemnification receivables from DuPont. For additional information on these matters, refer to Note 5.
3.Other includes receivables in relation to value added tax, general sales tax and other taxes, notes receivable and other receivables. No individual group represents more than 10% of total receivables for the periods presented.
NOTE 10 - INVENTORIES - NET
| In millions | December 31, 2025 | December 31, 2024 | ||||||
| Finished goods | $ | $ | ||||||
| Work in process | ||||||||
| Raw materials | ||||||||
| Supplies | ||||||||
| Less: Inventory reserves | ||||||||
| Total inventories - net | $ | $ | ||||||
F-25
NOTE 11 - PROPERTY, PLANT AND EQUIPMENT - NET
| Estimated Useful Lives (Years) | December 31, 2025 | December 31, 2024 | |||||||||||||||
| In millions | |||||||||||||||||
| Land and land improvements | - | $ | $ | ||||||||||||||
| Buildings | - | ||||||||||||||||
| Machinery, equipment, and other | - | ||||||||||||||||
| Construction in progress | |||||||||||||||||
| Total property, plant and equipment | $ | $ | |||||||||||||||
| Total accumulated depreciation | $ | ( | $ | ( | |||||||||||||
| Total property, plant and equipment - net | $ | $ | |||||||||||||||
| In millions | 2025 | 2024 | 2023 | ||||||||
| Depreciation expense | $ | $ | $ | ||||||||
NOTE 12 - NONCONSOLIDATED AFFILIATES
The Company's investments in companies accounted for using the equity method ("nonconsolidated affiliates") are recorded in "Investments and other noncurrent receivables" in the Consolidated Balance Sheets. The Company's net investment in nonconsolidated affiliates at December 31, 2025 and December 31, 2024 is $386 million and $382 million, respectively.
The Company's dividends received from nonconsolidated affiliates is shown in the following table:
| Dividends Received from Nonconsolidated Affiliates | 2025 | 2024 | 2023 | |||||||||||
| (In millions) For the years ended December 31, | ||||||||||||||
| Dividends from nonconsolidated affiliates | $ | $ | $ | |||||||||||
The Company had an ownership interest in three nonconsolidated affiliates, with each ownership interest representing 50 % at December 31, 2025.
At December 31, 2025 and 2024, the Company had a note payable to Hitachi Chem DuP Microsystems LLC (the “Related Party Note Payable”) of $53 million and $31 million, respectively. This note payable arises from an arrangement in which Parent manages the daily domestic cash position resulting from the normal cash operations of Hitachi Chem DuP Microsystems LLC. Under this arrangement, both parties may loan funds to one another based on the cash position of Hitachi Chem DuP Microsystems LLC.
Sales to nonconsolidated affiliates represented less than 1 1
NOTE 13 - GOODWILL AND OTHER INTANGIBLE ASSETS
The following table summarizes changes in the carrying amount of goodwill for the years ended December 31, 2025 and 2024:
| In millions | Semiconductor Technologies | Interconnect Solutions | Total | ||||||||
| Balance at December 31, 2023 | $ | $ | $ | ||||||||
| Currency Translation Adjustment | ( | ( | ( | ||||||||
| Other | |||||||||||
| Balance at December 31, 2024 | $ | $ | $ | ||||||||
| Currency Translation Adjustment | |||||||||||
| Balance at December 31, 2025 | $ | $ | $ | ||||||||
F-26
Annual Goodwill Impairment Testing
Effective in the first quarter of 2025, in anticipation of the Separation, DuPont realigned its segment structure. The realignment of DuPont’s segments served as a triggering event requiring the Company to perform an impairment analysis related to goodwill prior to and subsequent to the realignment. As part of the realignment, the Company assessed and redefined certain reporting units, including reallocation of goodwill on a relative fair value basis, as applicable, to the reporting units impacted. Goodwill impairment analyses were then performed for reporting units impacted and no impairments were identified.
As part of its annual impairment test at October 1, 2025, the Company performed qualitative testing on its two reporting units. The results of the qualitative assessments indicated that it is not more likely than not that the fair values of the two reporting units were less than their carrying values.
Other Intangible Assets
The gross carrying amounts and accumulated amortization of other intangible assets with finite lives, by major class are as follows:
| December 31, 2025 | December 31, 2024 | |||||||||||||||||||
| In millions | Gross Carrying Amount | Accumulated Amortization | Net | Gross Carrying Amount | Accumulated Amortization | Net | ||||||||||||||
| Intangible assets with finite lives: | ||||||||||||||||||||
| Developed technology | $ | $ | ( | $ | $ | $ | ( | $ | ||||||||||||
| Trademarks | ( | ( | ||||||||||||||||||
| Customer-related | ( | ( | ||||||||||||||||||
| Total other intangible assets | $ | $ | ( | $ | $ | $ | ( | $ | ||||||||||||
During the fiscal year 2025, the Company retired fully amortized assets of $74 million of developed technology intangible assets and $273 million of customer-related intangible assets. During the fiscal year 2024, the Company retired fully amortized assets of $65 million of developed technology intangible assets and $27 million of trademark intangible assets.
The following table provides the net carrying value of other intangible assets by segment:
| Net Intangibles | December 31, 2025 | December 31, 2024 | ||||||
| In millions | ||||||||
| Semiconductor Technologies | $ | $ | ||||||
| Interconnect Solutions | ||||||||
| Total | $ | $ | ||||||
The aggregate pre-tax amortization expense for intangible assets was $207 million, $232 million and $262 million, for the years ended December 31, 2025, 2024, and 2023, respectively.
Total estimated amortization expense for the next five fiscal years is as follows:
| Estimated Amortization Expense | |||||
| In millions | |||||
| 2026 | $ | ||||
| 2027 | $ | ||||
| 2028 | $ | ||||
| 2029 | $ | ||||
| 2030 | $ | ||||
F-27
NOTE 14 - SHORT-TERM BORROWINGS, LONG-TERM DEBT AND AVAILABLE CREDIT FACILITIES
The following tables summarize the Company's short-term borrowings, long-term debt and finance lease obligations:
| Short-Term Borrowings | December 31, 2025 | December 31, 2024 | ||||||
| (In millions) | ||||||||
| Long-term debt due within one year | $ | $ | ||||||
| Long-Term Debt | December 31, 2025 | December 31, 2024 | ||||||||||||
| In millions | Amount | Weighted Average Rate | Amount | Weighted Average Rate | ||||||||||
| Promissory notes and debentures: | ||||||||||||||
| Secured Notes due 2032 | $ | % | $ | % | ||||||||||
| Unsecured Notes due 2033 | % | % | ||||||||||||
| Other facilities: | ||||||||||||||
| Senior secured term loan facility due 2032 | % | % | ||||||||||||
| Less: Unamortized debt discount and issuance costs | ||||||||||||||
Less: Long-term debt due within one year | ||||||||||||||
| Total | $ | $ | ||||||||||||
The Secured Notes
On August 15, 2025, Qnity issued $1 billion aggregate principal amount of 5.750 % senior secured notes due 2032 (the "Secured Notes"), pursuant to an indenture dated as of August 15, 2025 (the “Secured Notes Indenture”), by and between Qnity and U.S. Bank Trust Company, National Association, as trustee (the "Secured Notes Trustee"), collateral agent and paying agent. The Secured Notes mature on August 15, 2032 and bear interest at a rate of 5.750 % per year. Interest on the Secured Notes is payable on February 15 and August 15 of each year, beginning on February 15, 2026.
The Secured Notes are jointly and severally and unconditionally guaranteed on a senior secured basis by each Qnity subsidiary that is a borrower, or guarantees indebtedness, under Qnity’s Senior Secured Credit Facilities. Upon the consummation of the Separation (or, with respect to the foreign collateral, the day after the consummation of the Separation), the Secured Notes and related guarantees were secured, subject to permitted liens and certain other exceptions, by first priority liens on substantially the same collateral that secure Qnity’s obligations under its Senior Secured Credit Facilities. The Secured Notes and related guarantees are secured on a pari passu basis with the Senior Secured Credit Facilities.
At any time prior to August 15, 2028, Qnity may redeem some or all of the Secured Notes at a price equal to 100 % of the principal amount thereof to be redeemed, plus a “make-whole” premium plus accrued and unpaid interest, if any, to, but not including, the redemption date. In addition, Qnity may redeem some or all of the Secured Notes at any time on or after August 15, 2028 at specified prices, plus accrued and unpaid interest, if any, up to, but not including, the redemption date. Qnity may also redeem up to 40 % of the aggregate principal amount of the Secured Notes at any time on or prior to August 15, 2028 using the net proceeds from certain equity offerings at 105.750 %, plus accrued and unpaid interest, if any, up to, but not including, the redemption date. If Qnity experiences certain kinds of changes in control, Qnity must offer to repurchase the Secured Notes at a price equal to 101 % of the principal amount of the Secured Notes, plus accrued and unpaid interest, if any, to, but not including, the repurchase date.
The Secured Notes Indenture includes certain covenants on the actions of Qnity and its restricted subsidiaries relating to debt incurrence, liens, restricted payments, assets sales and transactions with affiliates, changes in control, and mergers or sales of all or substantially all of Qnity’s assets. The Secured Notes Indenture provides for customary events of default (subject, in certain cases, to customary grace periods), which include nonpayment on the Secured Notes, breach of covenants in the Secured Notes Indenture, payment defaults or acceleration of other indebtedness over a specified threshold, failure to pay certain judgments over a specified threshold and certain events of bankruptcy and insolvency. Generally, if an event of default occurs, the Secured Notes Trustee or holders of at least 30 % of the aggregate principal amount of all then outstanding Secured Notes may declare the principal, premium, if any, interest and any other monetary obligations on all of the then outstanding Secured Notes to be due and payable immediately.
F-28
The Unsecured Notes
On August 15, 2025, Qnity issued $750 million aggregate principal amount of 6.250 % senior unsecured notes due 2033 (the “Unsecured Notes” and, together with the Secured Notes, the “Notes”) pursuant to an indenture dated as of August 15, 2025 (the “Unsecured Notes Indenture”), by and between Qnity and U.S. Bank Trust Company, National Association, as trustee (the “Unsecured Notes Trustee”) and paying agent, dated as of August 15, 2025. The Unsecured Notes mature on August 15, 2033 and bear interest at a rate of 6.250 % per year. Interest on the Unsecured Notes is payable on February 15 and August 15 of each year, beginning on February 15, 2026.
The Unsecured Notes are jointly and severally and unconditionally guaranteed on a senior unsecured basis by each Qnity subsidiary that is a borrower, or guarantees indebtedness, under Qnity’s Senior Secured Credit Facilities.
At any time prior to August 15, 2028, Qnity may redeem some or all of the Unsecured Notes at a price equal to 100 % of the principal amount thereof to be redeemed, plus a “make-whole” premium plus accrued and unpaid interest, if any, to, but not including, the redemption date. In addition, Qnity may redeem some or all of the Unsecured Notes at any time on or after August 15, 2028 at specified prices, plus accrued and unpaid interest, if any, to, but not including, the redemption date. Qnity may also redeem up to 40 % of the aggregate principal amount of the Unsecured Notes at any time on or prior to August 15, 2028 using the net proceeds from certain equity offerings at 106.250 %, plus accrued and unpaid interest, if any, to, but not including, the redemption date. If Qnity experiences certain kinds of changes in control, Qnity must offer to repurchase the Unsecured Notes at a price equal to 101 % of the principal amount of the Unsecured Notes, plus accrued and unpaid interest, if any, to, but not including, the repurchase date.
The Unsecured Notes Indenture includes certain covenants on the actions of Qnity and its restricted subsidiaries relating to debt incurrence, liens, restricted payments, assets sales, and transactions with affiliates, changes in control, and mergers or sales of all or substantially all of Qnity’s assets. The Unsecured Notes Indenture provides for customary events of default (subject, in certain cases, to customary grace periods), which include nonpayment on the Unsecured Notes, breach of covenants in the Unsecured Notes Indenture, payment defaults or acceleration of other indebtedness over a specified threshold, failure to pay certain judgments over a specified threshold and certain events of bankruptcy and insolvency. Generally, if an event of default occurs, the Unsecured Notes Trustee or holders of at least 30 % of the aggregate principal amount of all then outstanding Unsecured Notes may declare the principal, premium, if any, interest and any other monetary obligations on all of the then outstanding Unsecured Notes to be due and payable immediately.
Senior Secured Credit Facilities
On October 31, 2025 in connection with the Separation, the Company entered into a credit agreement (the "Credit Agreement") providing for (a) a five-year revolving credit facility in the aggregate committed amount of $1.25 billion (up to $100 million of such revolving facility is available for the issuance of letters of credit) (the "Senior Secured Revolving Facility"), and (b) a seven-year term loan facility in the aggregate principal amount of $2.35 billion (the "Senior Secured Term Loan Facility" and, together with the Senior Secured Revolving Facility, the "Senior Secured Credit Facilities"). The full amount of the Senior Secured Term Loan Facility, $2.35 billion, was funded on October 31, 2025, and paid directly to DuPont, along with the proceeds from the issuance of the Notes, in the form of a cash dividend in connection with the Separation.
The borrowings under the Senior Secured Credit Facilities bear interest at a rate per annum equal to either of the following, plus, in each case, an applicable margin: (a) the base rate or (b) term Secured Overnight Financing Rate ("SOFR"). The applicable margin for borrowings under the Senior Secured Revolving Facility ranges from 0.25 % to 1.25 % with respect to base rate borrowings and 1.25 % to 2.25 % with respect to term SOFR borrowings, in each case, based on the Company's consolidated first lien net leverage ratio. The applicable margin for borrowings under the Senior Secured Term Loan Facility is 1.00 % with respect to base rate borrowings and 2.00 % with respect to term SOFR borrowings.
The Company has scheduled amortization payments under the Senior Secured Term Loan Facility in equal quarterly installments in an annual amount equal to 1.00 % of the original principal amount of the term loans payable on the last day of each calendar quarter, with the unpaid balance being due and payable at maturity.
The Credit Agreement contains a number of negative covenants that, among other things and subject to certain exceptions, may restrict Qnity’s ability and the ability of each of our restricted subsidiaries to: incur additional indebtedness (including guarantees thereof); create liens on, sell or otherwise dispose of Qnity assets; enter into mergers, consolidations and other fundamental changes; make certain investments or acquisitions; engage in sale-leaseback transactions; repurchase Qnity common stock, pay dividends or make similar distributions or other restricted payments on Qnity capital stock; repay certain indebtedness; engage in certain affiliate transactions; and enter into agreements that restrict Qnity’s ability to create liens, pay dividends or make loan repayments.
F-29
With respect to the Senior Secured Revolving Facility, the related credit agreement requires that Qnity maintain, on a quarterly basis, a consolidated first lien net leverage ratio not to exceed 4.50 :1.00, tested at the end of each fiscal quarter, subject to an increase of 0.50 :1.00 in connection with the consummation of certain material acquisitions (defined in a customary manner) and applicable to the fiscal quarter in which such acquisition is consummated and the four consecutive full fiscal quarters thereafter. There were no drawdowns under the Senior Secured Revolving Facility during the year ended December 31, 2025. Outstanding letters of credit under the Senior Secured Revolving Facility were $12 million.
The Credit Agreement also contains representations and warranties, affirmative covenants and events of default, in each case, usual and customary for facilities and transactions of this type. As of December 31, 2025, the Company was in compliance with all applicable covenants included in the terms of its debt arrangements.
Principal payments of long-term debt for the five succeeding fiscal years and thereafter are as follows:
Maturities of Long-Term Debt for Next Five Years and Thereafter at December 31, 2025 | Total | ||||
| In millions | |||||
| 2026 | $ | ||||
| 2027 | |||||
| 2028 | |||||
| 2029 | |||||
| 2030 | |||||
| Thereafter | |||||
| Total maturities on long-term debt | $ | ||||
The estimated fair value of the Company's long-term borrowings was determined using Level 2 inputs within the fair value hierarchy. Based on quoted market prices for the same or similar issues, or on current rates offered to the Company for debt of the same remaining maturities, the fair value of the Company's long-term borrowings, including long-term debt due within one year, was $4,154 million at December 31, 2025.
Uncommitted Credit Facilities and Outstanding Letters of Credit
Unused bank credit lines on uncommitted credit facilities were approximately $339 million at December 31, 2025. These lines are available to support short-term liquidity needs and general corporate purposes including letters of credit. Outstanding letters of credit and credit lines under these uncommitted credit facilities were approximately $31 million at December 31, 2025. These letters of credit support commitments made in the ordinary course of business.
NOTE 15 - COMMITMENTS AND CONTINGENT LIABILITIES
Litigation Matters
In the normal course of business, the Company is involved from time to time in various arbitrations, lawsuits, claims and other actions with respect to patent infringement claims, employment claims, including alleged wage and hour violations, and commercial claims.
The Company accrues for such matters where losses are deemed probable and reasonably estimable. There are other matters involving the Company for which a loss is deemed remote or reasonably possible, and, as a result, associated accruals have not been established. It is reasonably possible that some of these matters could result in future payments or costs in excess of the amounts accrued at December 31, 2025, but such excess amounts cannot be reasonably estimated. It is the opinion of the Company’s management that the possibility is remote that the aggregate of all such claims and lawsuits will have a material adverse impact on the results of operations, financial condition and cash flows of the Company.
Certain Indemnification Obligations to DuPont
In connection with the Separation, Qnity has been contractually allocated, and directly pays or indemnifies DuPont for, the Applicable Qnity Percentage of certain liabilities, including current or future funding obligations of DuPont under the Memorandum of Understanding ("MOU"), legacy PFAS liabilities and liabilities related to businesses and operations of DuPont that were previously discontinued or divested. On December 2, 2025, Qnity and DuPont determined and agreed, pursuant to the Separation and Distribution Agreement, that the Applicable Qnity Percentage is 44 %. Indemnification liabilities have been determined and recorded based on this Applicable Qnity Percentage and in accordance with the applicable provisions in the Separation and Distribution Agreement and the and the Legacy Liabilities Assignment Agreement (including adjustments therein related to estimated income tax benefits arising from the liabilities allocated to us). These liabilities were recorded as a reduction to "Additional paid-in capital" in the Consolidated Balance Sheets as of the Separation and Distribution Date.
F-30
As of December 31, 2025, the Company has recorded indemnification liabilities related to the legacy liabilities detailed above of $80 million within “Accrued and other current liabilities” and $110 million within “Other noncurrent obligations” within the Consolidated Balance Sheets. It is reasonably possible that the potential exposure of these indemnifications could range up to $86 million above the amount accrued at December 31, 2025. It is also possible that the Company could incur additional costs or losses that may be material to its financial condition and its cash flows beyond those amounts accrued for or believed to be reasonably possible at this time. Such excess amounts cannot be reasonably estimated.
Liabilities under the MOU
On January 22, 2021, DuPont, Corteva, Inc. ("Corteva"), EIDP Inc. (formerly known as E. I. du Pont de Nemours and Company) (“EIDP”) and The Chemours Company ("Chemours") entered into the MOU in which the parties have agreed to share certain costs associated with qualified potential future liabilities. The MOU will be in effect until the earlier to occur of (i) December 31, 2040, (ii) the day on which the aggregate amount of Qualified Spend, as defined in the MOU, is equal to $4 billion or (iii) a termination in accordance with the terms of the MOU.
The parties have agreed that, during the term of the MOU, Qualified Spend up to $4 billion will be borne 50 % by Chemours and 50 % by DuPont and Corteva. DuPont will bear 71 % and Corteva will bear 29 % of their 50 % of Qualified Spend; accordingly, DuPont’s portion of the $2 billion is approximately $1.4 billion.
As of December 31, 2025, DuPont has borne Qualified Spend of approximately $700 million and has recorded an indemnification liability for probable and reasonably estimable future Qualified Spend of $185 million. Qnity has recorded an indemnification liability for such probable and reasonably estimable future Qualified Spend of $75 million which represents Applicable Qnity Percentage of 44 % of DuPont's after-tax liability.
New Jersey
On August 3, 2025, DuPont, together with Chemours and Corteva and its subsidiary, EIDP, agreed to a proposed Judicial Consent Order (the “Consent Order”) with the State of New Jersey to resolve outstanding claims by the state pending against the companies related to legacy use of a wide variety of substances of concern for an aggregate cash settlement payment to the state of $875 million, payable over a period of 25 years. The first of the scheduled annual payments will be due within 30 days of Court approval of the Consent Order, but no earlier than January 31, 2026.
As of December 31, 2025, DuPont maintains a pre-tax charge of $177 million related to the proposed Consent Order. The Company has recorded $66 million for our contractually allocated portion of the recorded pre-tax charge. Additionally, DuPont recorded interest accretion of $9 million during the year ended December 31, 2025, resulting in a liability of $186 million as of December 31, 2025. Qnity has recorded $3 million for its contractually allocated portion of this accreted interest. We will share in the ongoing costs of maintaining a reserve fund in the event the remedial funding source for a site has been exhausted and the party responsible is not otherwise performing the required remediation.
Contingent upon the settlement being approved by the Court, DuPont and Corteva will purchase Chemours’ interest in future, if any, insurance proceeds related to PFAS claims. DuPont and Corteva will make the purchase by contributing a total of $150 million into an escrow fund (the “NJ Insurance Escrow”) to be applied to Chemours’ share of the settlement. In exchange, Chemours shall assign to DuPont and Corteva its rights to $150 million of PFAS-related insurance proceeds plus a fee equal to the lesser of (a) $35 million, or (b) $3 million plus interest (at prime minus 2 %) on the unrecovered fraction of $150 million, until Chemours’ share of insurance recoveries fully recoups the purchase price.
The Company’s contractually allocated cash contribution in respect of the NJ Insurance Escrow will be $47 million, contingent upon the settlement being approved by the Court. The Company will also receive the Applicable Qnity Percentage of any insurance proceeds related to PFAS claims recovered.
The obligations of DuPont set forth in this section relating to the Settlement, including the cash payments, any remediation obligations (and related liabilities), and the establishment and maintenance of the reserve fund, and the purchase of Chemours’ interest in future insurance proceeds related to PFAS claims, in each case constitute, liabilities contractually allocated between us and DuPont based their respective Applicable Percentage under the Separation and Distribution Agreement. Accordingly, Qnity will indemnify DuPont, or remit directly to the relevant third party, the amount owed in respect of our share of such liabilities.
Other
As of December 31, 2025, DuPont has recorded liabilities related to business and operations, historical activities of DuPont, including environmental liabilities, and its present and former subsidiaries, for which the Company has recorded $46 million for its contractually allocated portion.
F-31
Guarantees
The Company entered into a cost sharing agreement (the “ESL Cost Sharing Agreement”) relating to the sharing of certain ownership and operating expenses at Experimental Station, where we will also be leasing space from DuPont under a separate operating lease. Under the ESL Cost Sharing Agreement, DuPont and Qnity will be responsible for 60 % and 40 %, respectively, of certain costs and expenses that exceed the net revenues received by DuPont from certain third parties at Experimental Station. While the term of the ESL Cost Sharing Agreement will be perpetual, DuPont will be required to use commercially reasonable efforts to mitigate such ownership and operating expenses, and Qnity will not be responsible for the extent of any increase in Experimental Station ownership or operating expenses due to DuPont’s loss of rent from Qnity that may result if we terminate our separate operating lease at the site and DuPont is unable to secure a new tenant for our space. We will also not be responsible for any increase in Experimental Station ownership and operating expenses that may result from any decrease in use of space at Experimental Station by DuPont or its subsidiaries following the Spin-Off. The Company determined that our stand-ready obligation to reimburse DuPont under this agreement represents a guarantee under ASC 460 and recorded a liability within "Other noncurrent obligations" in the Consolidated Balance Sheets of $70 million as of the Separation Date as part of our distribution accounting in separation from DuPont based on our estimate of fair value. These liabilities were recorded as a reduction to "Additional paid-in capital" in the Consolidated Balance Sheets as of the Separation and Distribution Date. The Company has not been required to make a payment under this agreement to date. The carrying value of this liability at December 31, 2025, approximates the amount recorded at Separation.
NOTE 16 - LEASES
The Company has operating leases for real estate, fleet, and certain machinery and equipment. The Company’s leases have remaining lease terms of approximately 1 year to 19 years. For purposes of calculating operating lease liabilities, lease terms may be deemed to include options to extend the lease when it is reasonably certain that the Company will exercise that option. Some leasing arrangements require variable payments that are dependent on usage, output, or may vary for other reasons, such as insurance and tax payments. The variable lease payments are not presented as part of the initial ROU asset or lease liability.
The components of lease cost for operating leases for the years ended December 31, 2025, 2024 and 2023 were as follows:
| In millions | 2025 | 2024 | 2023 | ||||||||
| Operating lease cost | $ | $ | $ | ||||||||
Variable lease cost 1 | |||||||||||
Less: Sublease income 2 | |||||||||||
| Total lease cost | $ | $ | $ | ||||||||
1.Variable lease cost excludes costs that have been capitalized into inventory of approximately $15 million in each year presented.
2.Reflects income associated with subleases, not inclusive of all lessor arrangements disclosed below.
Operating cash flows from operating leases were $42 million, $40 million, and $38 million for the year ended December 31, 2025, 2024 and 2023, respectively.
New operating lease assets and liabilities entered into during the year ended December 31, 2025, 2024 and 2023 were $410 million, $11 million and $83 million, respectively. Of the operating leases entered into during the year ended December 31, 2025, approximately $347 million relate to facilities leased from DuPont following the Separation. Supplemental balance sheet information related to leases was as follows:
| In millions | December 31, 2025 | December 31, 2024 | ||||||
Operating Leases | ||||||||
Operating lease right-of-use assets 1 | $ | $ | ||||||
Current operating lease liabilities 2 | ||||||||
Noncurrent operating lease liabilities 3 | ||||||||
| $ | $ | |||||||
1.Included in "" in the Consolidated Balance Sheets.
2.Included in "" in the Consolidated Balance Sheets.
3.Included in "" in the Consolidated Balance Sheets.
F-32
Operating lease ROU assets and lease liabilities are recognized at the commencement date based on the present value of lease payments over the lease term. As most of the Company’s leases do not provide the lessor’s implicit rate, the Company uses its incremental borrowing rate at the commencement date in determining the present value of lease payments.
| Lease Term and Discount Rate for Operating Leases | December 31, 2025 | December 31, 2024 | ||||||
| Weighted-average remaining lease term (years) | ||||||||
| Weighted-average discount rate | % | % | ||||||
Maturities of lease liabilities were as follows:
| Maturity of Lease Liabilities at December 31, 2025 | Operating Leases | ||||
| In millions | |||||
| 2026 | $ | ||||
| 2027 | |||||
| 2028 | |||||
| 2029 | |||||
| 2030 | |||||
| 2031 and thereafter | |||||
| Total lease payments | $ | ||||
| Less: Interest | |||||
| Present value of lease liabilities | $ | ||||
NOTE 17 - STOCKHOLDERS' EQUITY
Common Stock
The following table provides a reconciliation of Qnity Common Stock for the year ended December 31, 2025:
| Common Stock | Issued | ||||
| In thousands | |||||
| Balance at November 3, 2025 (Separation and Distribution Date) | |||||
| Issued | |||||
Balance at December 31, 2025 | |||||
The Company did not hold any shares of Common Stock in treasury and no shares were repurchased or retired during the year ended December 31, 2025.
Retained Earnings
There are no significant restrictions limiting the Company's ability to pay dividends. Dividends declared and paid to common stockholders during the years ended December 31, 2025 are summarized in the following table:
| Dividends Declared and Paid | 2025 | ||||
| In millions | |||||
| Dividends declared to common stockholders | $ | ||||
| Dividends paid to common stockholders | $ | ||||
F-33
Accumulated Other Comprehensive Loss
The following table summarizes the activity related to each component of AOCI for the years ended December 31, 2025, 2024 and 2023:
| Accumulated Other Comprehensive Loss | Cumulative Translation Adj | Pension and OPEB | Total | ||||||||
| In millions | |||||||||||
| 2023 | |||||||||||
| Balance at January 1, 2023 | $ | ( | $ | $ | ( | ||||||
| Other comprehensive loss | ( | ( | ( | ||||||||
| Balance at December 31, 2023 | $ | ( | $ | $ | ( | ||||||
| 2024 | |||||||||||
| Other comprehensive (loss) income | ( | ( | |||||||||
| Balance at December 31, 2024 | $ | ( | $ | $ | ( | ||||||
| 2025 | |||||||||||
| Other comprehensive income (loss) before reclassifications | ( | ||||||||||
| Amounts reclassified from accumulated other comprehensive income | |||||||||||
| Other comprehensive income (loss) | $ | $ | ( | $ | |||||||
| Separation-related adjustments | ( | ( | |||||||||
| Balance at December 31, 2025 | $ | ( | $ | $ | ( | ||||||
The tax effects on the net activity related to each component of other comprehensive loss were not significant for the years ended December 31, 2025, 2024 and 2023.
NOTE 18 - PENSION PLANS AND OTHER POST-EMPLOYMENT BENEFITS
As a result of the Separation and in connection with the Separation and Distribution Agreement and Employee Matters Agreement, Qnity assumed benefit obligations and related plan assets relating to certain DuPont non-U.S. pension and OPEB plans. These obligations were assumed into newly established plans set up in the month leading up to the separation. As a result of the transfer at Separation, approximately $312 million of obligations offset by approximately $299 million of plan assets, were transferred to Qnity.
Defined Benefit Pension Plans
Qnity offers both funded and unfunded contributory and noncontributory defined benefit pension plans in certain non-U.S. jurisdictions.
Qnity's funding policy is consistent with the funding requirements of each country's laws and regulations. Pension coverage for employees of Qnity's non-U.S. consolidated subsidiaries is provided, to the extent deemed appropriate, through separate plans. Obligations under such plans are funded by depositing funds with trustees, covered by insurance contracts, or remain unfunded. The benefits under these plans are based primarily on years of service and employees' pay near retirement. During 2025, the Company contributed $10 million to its benefit plans. Qnity expects to contribute approximately $6 million to its benefit plans in 2026.
The weighted-average assumptions used to determine benefit obligations and net periodic benefit costs for all plans are summarized in the table below:
| Weighted-Average Assumptions for Pension Plans | Benefit Obligations at December 31, | Net Periodic Costs for the Years Ended | |||||||||||||||
| 2025 | 2024 | 2025 | 2024 | 2023 | |||||||||||||
| Discount rate | % | % | % | % | % | ||||||||||||
| Interest crediting rate for applicable benefits | % | % | % | % | % | ||||||||||||
| Rate of compensation increase | % | % | % | % | % | ||||||||||||
| Expected return on plan assets | N/A | N/A | % | % | % | ||||||||||||
F-34
Other Post-employment Benefit Plans
The company provides medical, dental and life insurance benefits to certain pensioners and survivors in the U.S. and foreign locations. The associated plans for retiree benefits are unfunded and the cost of the approved claims is paid from company funds. In comparison to the Company’s defined benefit pension plans, the Company’s other post-employment benefit plans are not significant. The total other post-employment benefits projected benefit obligation was $13 million as of December 31, 2025 and zero as of December 31, 2024.
Assumptions
The Company determines the expected long-term rate of return on plan assets by performing a detailed analysis of key economic and market factors driving historical returns for each asset class and formulating a projected return based on factors in the current environment. Factors considered include, but are not limited to, inflation, real economic growth, interest rate yield, interest rate spreads, and other valuation measures and market metrics.
Service cost and interest cost for all other plans are determined on the basis of the discount rates derived in determining those plan obligations. The discount rates utilized to measure the majority of pension obligations are based on the Aon AA corporate bond yield curves applicable to each country at the measurement date. The Company utilizes the mortality tables and generational mortality improvement scales, where available, developed in each of the respective countries in which the Company holds plans.
Summarized information on the Company’s pension and other postretirement benefit plans is as follows:
| Change in Projected Benefit Obligations of All Plans | 2025 | 2024 | ||||||
| In millions | ||||||||
| Change in projected benefit obligations: | ||||||||
| Benefit obligations at beginning of year | $ | $ | ||||||
| Service cost | ||||||||
| Interest cost | ||||||||
Actuarial changes in assumptions and experience | ( | ( | ||||||
| Benefits paid | ( | ( | ||||||
| Obligations assumed from parent at separation | ||||||||
| Settlement | ( | |||||||
| Effect of foreign exchange rates | ( | |||||||
| Benefit obligations at end of year | $ | $ | ||||||
| Change in Plan Assets and Funded Status of All Plans | 2025 | 2024 | ||||||
| In millions | ||||||||
| Change in plan assets: | ||||||||
| Fair value of plan assets at beginning of year | $ | $ | ||||||
| Actual return on plan assets | ( | |||||||
| Employer contributions | ||||||||
| Benefits paid | ( | ( | ||||||
| Assets assumed from parent at separation | ||||||||
| Settlement | ( | |||||||
| Effect of foreign exchange rates | ( | |||||||
| Fair value of plan assets at end of year | $ | $ | ||||||
| Funded status: | ||||||||
| Plans with plan assets | $ | ( | $ | ( | ||||
| All other plans | ( | ( | ||||||
| Funded status at end of year | $ | ( | $ | ( | ||||
F-35
The following tables summarize the amounts recognized in the Consolidated Balance Sheets for all significant plans:
| Amounts Recognized in the Consolidated Balance Sheets for All Significant Plans | December 31, 2025 | December 31, 2024 | ||||||
| In millions | ||||||||
| Amounts recognized in the Consolidated Balance Sheets: | ||||||||
| Deferred charges and other assets | $ | $ | ||||||
| Accrued and other current liabilities | ( | ( | ||||||
| Pensions and other post-employment benefits - non-current | ( | ( | ||||||
| Net amount recognized | $ | ( | $ | ( | ||||
| Pretax amounts recognized in accumulated other comprehensive loss (income): | ||||||||
| Net gain | $ | ( | $ | ( | ||||
| Prior service credit | ( | |||||||
| Net amount recognized | $ | ( | $ | ( | ||||
The decrease in the Company’s actuarial gains for the year ended December 31, 2025 and the increase in actuarial gains for the year ended December 31, 2024 were primarily due to the changes in weighted-average discount rates.
The accumulated benefit obligation for all pension plans was $385 million and $158 million at December 31, 2025 and 2024, respectively.
| Pension Plans with Accumulated Benefit Obligations in Excess of Plan Assets | December 31, 2025 | December 31, 2024 | ||||||
| In millions | ||||||||
| Accumulated benefit obligations | $ | $ | ||||||
| Fair value of plan assets | $ | $ | ||||||
| Pension Plans with Projected Benefit Obligations in Excess of Plan Assets | December 31, 2025 | December 31, 2024 | ||||||
| In millions | ||||||||
| Projected benefit obligations | $ | $ | ||||||
| Fair value of plan assets | $ | $ | ||||||
| Net Periodic Benefit Costs for All Significant Plans for the Years Ended December 31, | 2025 | 2024 | 2023 | ||||||||
| In millions | |||||||||||
| Net Periodic Benefit Costs: | |||||||||||
| Service cost | $ | $ | $ | ||||||||
| Interest cost | |||||||||||
| Expected return on plan assets | ( | ( | ( | ||||||||
| Amortization of unrecognized net gain | ( | ||||||||||
| Settlement | |||||||||||
| Net periodic benefit costs - Total | $ | $ | $ | ||||||||
| Changes in plan assets and benefit obligations recognized in other comprehensive loss: | |||||||||||
| Net (gain) loss | $ | ( | $ | ( | $ | ||||||
| Amortization of unrecognized gain | |||||||||||
| Settlement loss | |||||||||||
| Impact of obligations from parent assumed at separation | |||||||||||
| Effect of foreign exchange rates | ( | ( | |||||||||
| Total recognized in other comprehensive loss (income) | $ | $ | ( | $ | |||||||
| Total recognized in net periodic benefit costs (credits) and other comprehensive loss (income) | $ | $ | ( | $ | |||||||
F-36
Estimated Future Benefit Payments
The estimated future benefit payments as of December 31, 2025, reflecting expected future service, as appropriate, are presented in the following table:
| Estimated Future Benefit Payments at December 31, 2025 | |||||
| In millions | |||||
| 2026 | $ | ||||
| 2027 | |||||
| 2028 | |||||
| 2029 | |||||
| 2030 | |||||
| Years 2031-2035 | |||||
| Total | $ | ||||
Plan Assets
Plan assets consist primarily of pooled investment vehicles, other investments such as private market securities and interest-earning cash balances, and alternative investments such as insurance contracts. At December 31, 2025, plan assets totaled $357 million.
The Company establishes strategic asset allocation percentage targets and appropriate benchmarks for significant asset classes with the aim of achieving a prudent balance between return and risk. Strategic asset allocations in other countries are selected in accordance with the laws and practices of those countries. Where appropriate, asset liability studies are utilized in this process. The assets are managed by professional investment firms unrelated to the Company. Pension trust funds are permitted to enter into certain contractual arrangements generally described as derivative instruments. Derivatives are primarily used to reduce specific market risks, hedge currency and adjust portfolio duration and asset allocation in a cost-effective manner.
Equity securities primarily included investments in large- and small-cap companies located in both developed and emerging markets around the world. Global equity securities include varying market capitalization levels. U.S. equity investments are primarily large-cap companies. Fixed income securities included investment and non-investment grade corporate bonds of companies diversified across industries, U.S. treasuries, non-U.S. developed market securities, U.S. agency mortgage-backed securities, emerging market securities and fixed income related funds. Global fixed income investments include corporate-issued, government-issued and asset-backed securities. Corporate debt investments include a range of credit risk and industry diversification. Alternative investments primarily included investments in various insurance contracts. Pooled investment vehicles and hedge funds primarily included funds investing in publicly traded equities, fixed income securities, and other diversified alternative strategies. Other investments included private market securities and cash and cash equivalents.
The weighted-average target allocation for plan assets of the Company’s pension plans is summarized as follows:
| Target Allocation for Plan Assets at December 31, 2025 | Qnity | ||||
| Asset Category | |||||
| Equity securities | % | ||||
| Fixed income securities | |||||
| Alternative investments | |||||
| Hedge funds | |||||
| Other investments | |||||
| Total | % | ||||
Fair value calculations may not be indicative of net realizable value or reflective of future fair values. Furthermore, although the Company believes its valuation methods are appropriate and consistent with other market participants, the use of different methodologies or assumptions to determine the fair value of certain financial instruments could result in a different fair value measurement at the reporting date.
For pension plan assets classified as Level 1 measurements (measured using quoted prices in active markets), total fair value is either the price of the most recent trade at the time of the market close or the official close price, as defined by the exchange on which the asset is most actively traded on the last trading day of the period, multiplied by the number of units held without consideration of transaction costs.
F-37
For pension plan assets classified as Level 2 measurements, where the security is frequently traded in less active markets, fair value is based on the closing price at the end of the period; where the security is less frequently traded, fair value is based on the price a dealer would pay for the security or similar securities, adjusted for any terms specific to that asset or liability. Market inputs are obtained from well-established and recognized vendors of market data and subjected to tolerance and quality checks.
For pension plan assets classified as Level 3 measurements, total fair value is based on significant unobservable inputs including assumptions where there is little, if any, market activity for the investment. Valuations of the investments are provided by investment managers or fund managers. These valuations are reviewed for reasonableness based on applicable sector, benchmark and company performance. Valuations of insurance contracts are contractually determined and are based on exit price valuations or contract value. Adjustments to valuations are made where appropriate.
Certain pension plan assets are held in funds where fair value is based on an estimated net asset value per share (or its equivalent) as of the most recently available fund financial statements which are received on a monthly or quarterly basis. These valuations are reviewed for reasonableness based on applicable sector, benchmark and company performance. Adjustments to valuations are made where appropriate to arrive at an estimated net asset value per share at the measurement date. Where available, audited annual financial statements are obtained and reviewed for the investments as support for the manager’s investment valuation. These funds are not classified within the fair value hierarchy.
The following table summarizes the basis used to measure the Company’s pension plan assets at fair value for the years ended December 31, 2025 and 2024:
| Basis of Fair Value Measurements | December 31, 2025 | December 31, 2024 | ||||||||||||||||||||||||
| In millions | Total | Level 1 | Level 2 | Level 3 | Total | Level 1 | Level 2 | Level 3 | ||||||||||||||||||
| Cash and cash equivalents | $ | $ | $ | $ | $ | $ | $ | $ | ||||||||||||||||||
| Equity securities: | ||||||||||||||||||||||||||
| U.S. equity securities | $ | $ | $ | $ | $ | $ | $ | $ | ||||||||||||||||||
| Non - U.S. equity securities | ||||||||||||||||||||||||||
| Total equity securities | $ | $ | $ | $ | $ | $ | $ | $ | ||||||||||||||||||
| Fixed income securities: | ||||||||||||||||||||||||||
| Debt - government-issued | $ | $ | $ | $ | $ | $ | $ | $ | ||||||||||||||||||
| Debt - corporate-issued | ||||||||||||||||||||||||||
| Total fixed income securities | $ | $ | $ | $ | $ | $ | $ | $ | ||||||||||||||||||
| Alternative investments: | ||||||||||||||||||||||||||
| Insurance contracts | ||||||||||||||||||||||||||
| Other Investments: | ||||||||||||||||||||||||||
| Pooled Investment Vehicles | $ | $ | $ | $ | $ | $ | $ | $ | ||||||||||||||||||
| Other investments | ||||||||||||||||||||||||||
| Total other investments | $ | $ | $ | $ | $ | $ | $ | $ | ||||||||||||||||||
| Total | $ | $ | $ | $ | $ | $ | $ | $ | ||||||||||||||||||
| Investments measured at net asset value: | ||||||||||||||||||||||||||
| Pooled investment vehicles & hedge funds | ||||||||||||||||||||||||||
| Private market securities | ||||||||||||||||||||||||||
Total investments measured at net asset value | $ | $ | ||||||||||||||||||||||||
Items to reconcile to fair value of plan assets: | ||||||||||||||||||||||||||
Plan receivables 1 | ||||||||||||||||||||||||||
| Total | $ | $ | ||||||||||||||||||||||||
F-38
The following table summarizes the changes in the fair value of Level 3 pension plan assets for the years ended December 31, 2025 and 2024:
| Fair Value Measurement of Level 3 Pension Plan Assets | Insurance Contracts | ||||
| In millions | |||||
| Balance at Jan 1, 2024 | $ | ||||
| Actual return on assets: | |||||
| Relating to assets held at Dec 31, 2024 | ( | ||||
| Purchases, sales and settlements, net | ( | ||||
Transfers out of Level 3 1 | |||||
| Balance at Dec 31, 2024 | $ | ||||
| Actual return on assets: | |||||
| Relating to assets held at Dec 31, 2025 | ( | ||||
| Purchases, sales and settlements, net | ( | ||||
| Assets transferred from DuPont | |||||
| Balance at Dec 31, 2025 | $ | ||||
Defined Contribution Plans
The Company provides defined contribution benefits to its employees. The most significant is the U.S. Retirement Savings Plan (“the Plan”), which covers all U.S. regular full-time employees. The purpose of the Plan is to provide retirement savings benefits for employees. The Plan is a tax qualified contributory profit sharing plan, with cash or deferred arrangement and any eligible employee of the Company may participate. Currently, the Company contributes 100 % of the first 6 % of the employee’s contribution election and also contributes 3 % of each eligible employee’s eligible compensation regardless of the employee’s contribution. Qnity’s matching contributions vest immediately upon contribution. The 3 % nonmatching employer contribution vests after employees complete three years of service. The Company’s matching contributions to the Plan were $17 million in 2025, $21 million in 2024, and $22 million in 2023. The Company’s nonmatching contributions to the Plan were $11 12 million in 2023. In total, the Company’s contributions to the Plan were $28 million in 2025, $32 million in 2024, and $34 million in 2023.
NOTE 19 - STOCK-BASED COMPENSATION
The Company adopted the Qnity Electronics, Inc. Equity and Incentive Plan ("EIP") in connection with the Separation. Under the EIP, the Company may grant options, stock appreciation rights ("SARs"), restricted shares, restricted stock units ("RSUs"), share bonuses, other share-based awards, cash awards, conversion awards, each as defined within the EIP, or any combination of the foregoing. Under the EIP, a maximum of 16 million shares of common stock are available for award as December 31, 2025.
Outstanding DuPont-denominated equity awards at the time of Separation were converted using the conversion ratio that was determined in accordance with the Employee Matters Agreement. The awards have the same terms and conditions under the applicable plans and award agreements prior to the Separation transactions. The conversion of equity awards resulted in incremental modification expense of less than $1 million.
The Company recognized share-based compensation expense of $20 million for the year ended December 31, 2025 and $13 4 million for the year ended December 31, 2025 and $3
Total unrecognized pretax compensation cost related to nonvested stock option awards of $21 million at December 31, 2025, is expected to be recognized over a weighted-average period of 2.9 years. Total unrecognized pretax compensation cost related to RSUs and performance based stock units ("PSUs") of $58 million at December 31, 2025, is expected to be recognized over a weighted average period of 2.3 years. The total fair value of RSUs and PSUs under the EIP vested in the year ended December 31, 2025 was $1 million. The weighted average grant-date fair value of RSUs and PSUs granted under the EIP during 2025 was $97.98 .
F-39
Qnity Electronics, Inc. Equity and Incentive Plan
EIP Stock Options
The exercise price of shares subject to option is equal to the market price of the Company's stock on the date of grant. Stock option awards generally vest over a three-year period and expire 10 years after the grant date.
The Company uses the Black-Scholes option pricing model to determine the fair value of stock option awards and the assumptions set forth in the table below. The weighted-average assumptions used to calculate total stock-based compensation are included in the following table:
| EIP Weighted-Average Assumptions | 2025 | ||||
| Dividend yield | % | ||||
| Expected volatility | % | ||||
| Risk-free interest rate | % | ||||
| Expected life of stock options granted during period (years) | |||||
The Company determines the dividend yield by dividing the annualized dividend on Qnity's common stock by the option exercise price. Expected volatility was derived from a blended historical and implied volatility of peer companies as Qnity does not have sufficient historical volatility based on the expected term of the underlying options. The risk-free interest rate is determined by reference to the yield on an outstanding U.S. Treasury note with a term equal to the expected life of the option granted. Expected life is determined using a simplified approach, calculated as the mid-point between the vesting period and the contractual life of each vesting tranche of the award.
The following table summarizes stock option activity for 2025 under the EIP:
| EIP Stock Options | Number of Shares (in thousands) | Weighted Average Exercise Price (per share) | Weighted Average Remaining Contractual Term (in years) | Aggregate Intrinsic Value (in thousands) | ||||||||||
| Outstanding at January 1, 2025 | $ | |||||||||||||
| Awards converted from DuPont plans | $ | |||||||||||||
| Granted | $ | |||||||||||||
| Exercised | ( | $ | ||||||||||||
| Forfeited/Expired | $ | |||||||||||||
| Outstanding at December 31, 2025 | $ | $ | ||||||||||||
| Exercisable at December 31, 2025 | $ | $ | ||||||||||||
Additional Information about EIP Stock Options 1 | |||||
| In millions, except per share amounts | 2025 | ||||
Weighted-average fair value per share of options granted 1 | $ | ||||
Total compensation expense for stock options plans 2 | $ | ||||
Related tax benefit 2 | $ | ||||
1. No
2. These amounts represent life to date.
The aggregate intrinsic values in the table above represent the total pretax intrinsic value (the difference between the closing stock price on the last trading day of 2025 and the exercise price, multiplied by the number of in-the-money options) that would have been received by the option holders had all option holders exercised their in-the-money options at year end.
EIP Restricted Stock Units and Performance Based Stock Units
The Company grants RSUs to certain employees that generally vest over a three-year period and, upon vesting, settle one -for-one into Qnity common stock. The fair value of all RSUs is based upon the market price of the underlying common stock as of the grant date.
The Company grants PSUs to senior leadership under the EIP. Vesting occurs over a three-year period for PSUs granted and is based upon achieving certain metrics over a three-year performance period. The actual award is delivered as Qnity common stock. The weighted-average grant-date fair value of the PSUs is based upon the market price of the underlying common stock as of the grant date and estimated using a Monte Carlo simulation.
F-40
Nonvested awards of RSUs and PSUs are shown below:
| EIP RSUs and PSUs | Number of Shares (in thousands) | Weighted Average Grant Date Fair Value (per share) | ||||||
| Nonvested at January 1, 2025 | $ | |||||||
| Awards converted from DuPont plans | $ | |||||||
| Granted | $ | |||||||
| Vested | ( | $ | ||||||
| Forfeited | ( | $ | ||||||
| Nonvested at December 31, 2025 | $ | |||||||
NOTE 20 - FINANCIAL INSTRUMENTS
The following table summarizes the fair value of financial instruments at December 31, 2025 and December 31, 2024:
| Fair Value of Financial Instruments | December 31, 2025 | December 31, 2024 | ||||||||||||||||||||||||
| In millions | Cost | Gain | Loss | Fair Value | Cost | Gain | Loss | Fair Value | ||||||||||||||||||
| Cash equivalents | $ | $ | — | $ | — | $ | $ | $ | — | $ | — | $ | ||||||||||||||
| Derivatives relating to: | ||||||||||||||||||||||||||
Foreign currency 1,2 | ||||||||||||||||||||||||||
| Total derivatives | $ | $ | $ | $ | $ | $ | $ | $ | ||||||||||||||||||
1.Classified as "Prepaid and other current assets" and "Accrued and other current liabilities" in the Consolidated Balance Sheets.
2.Presented net of cash collateral where master netting arrangements allow.
Derivative Instruments
Objectives and Strategies for Holding Derivative Instruments
In the ordinary course of business, the Company may enter into contractual arrangements (derivatives) to reduce its exposure to foreign currency, interest rate and commodity price risks. Derivative programs have procedures and controls and are approved by the Corporate Financial Risk Management Committee, consistent with the Company's financial risk management policies and guidelines. These programs reflect varying levels of exposure coverage and time horizons based on an assessment of risk.
The Company's financial risk management procedures also address counterparty credit approval, limits and routine exposure monitoring and reporting. The counterparties to these contractual arrangements are major financial institutions and major commodity exchanges. The Company is exposed to credit loss in the event of nonperformance by these counterparties. The Company utilizes collateral support annex agreements with certain counterparties to limit its exposure to credit losses. The Company anticipates performance by counterparties to these contracts and therefore no material loss is expected. Market and counterparty credit risks associated with these instruments are regularly reported to management.
The notional amounts of the Company's derivative instruments were as follows:
| Notional Amounts | December 31, 2025 | December 31, 2024 | ||||||
| In millions | ||||||||
| Derivatives not designated as hedging instruments: | ||||||||
Foreign currency contracts 1 | $ | ( | $ | |||||
F-41
Derivatives not Designated in Hedging Relationships
Foreign Currency Contracts
The Company routinely uses forward exchange contracts to reduce its net exposure, by currency, related to foreign currency-denominated monetary assets and liabilities of its operations so that exchange gains and losses resulting from exchange rate changes are minimized. The netting of such exposures precludes the use of hedge accounting; however, the required revaluation of the forward contracts and the associated foreign currency-denominated monetary assets and liabilities intends to achieve a minimal earnings impact, after taxes. The Company also uses foreign currency exchange contracts to offset a portion of the Company's exposure to certain foreign currency-denominated revenues so that gains and losses on the contracts offset changes in the USD value of the related foreign currency-denominated revenues.
NOTE 21 - FAIR VALUE MEASUREMENTS
Fair Value Measurements on a Recurring Basis
The following tables summarize the basis used to measure certain assets and liabilities at fair value on a recurring basis:
Basis of Fair Value Measurements on a Recurring Basis of Significant Other Observable Inputs (Level 2) | December 31, 2025 | December 31, 2024 | ||||||
| In millions | ||||||||
| Assets at fair value: | ||||||||
Cash equivalents 1 | $ | $ | ||||||
Derivatives relating to: 2 | ||||||||
Foreign currency contracts 3 | ||||||||
| Total assets at fair value | $ | $ | ||||||
| Liabilities at fair value: | ||||||||
Derivatives relating to: 2 | ||||||||
Foreign currency contracts 3 | ||||||||
| Total liabilities at fair value | $ | $ | ||||||
1.Time deposits included in "Cash and cash equivalents" in the Consolidated Balance Sheets are held at amortized cost, which approximates fair value.
2.See Note 20 for the classification of derivatives in the Consolidated Balance Sheets.
For assets and liabilities classified as Level 2 measurements, where the security is frequently traded in less active markets, fair value is based on the closing price at the end of the period; where the security is less frequently traded, fair value is based on the price a dealer would pay for the security or similar securities, adjusted for any terms specific to that asset or liability, or by using observable market data points of similar, more liquid securities to imply the price. For time deposits classified as held-to-maturity investments and reported at amortized cost, fair value is based on an observable interest rate for similar securities. Market inputs are obtained from well-established and recognized vendors of market data and subjected to tolerance and quality checks.
For derivative assets and liabilities, standard industry models are used to calculate the fair value of the various financial instruments based on significant observable market inputs, such as foreign exchange rates, commodity prices, swap rates, interest rates and implied volatility obtained from various market sources. Market inputs are obtained from well-established and recognized vendors of market data and subjected to tolerance/quality checks.
There were no transfers between Levels 1 and 2 during the years ended December 31, 2025 and December 31, 2024.
F-42
NOTE 22 - SEGMENTS AND GEOGRAPHIC REGIONS
The Company's segments are aligned with the market verticals they serve, while maintaining integration and innovation strengths within strategic value chains. The Company's Chief Executive Officer is its CODM. Effective in the first quarter of 2025, in anticipation of the Separation, DuPont and Qnity realigned their segment structure. As a result of this realignment, Qnity consists of two
The Company's measure of profit/loss for segment reporting purposes is Adjusted Operating EBITDA as this is the manner in which the CODM assesses performance and allocates resources. The CODM utilizes Adjusted Operating EBITDA to assess financial performance and allocate resources by comparing actual results to historical and previously forecasted results. Beginning with this reporting period, the Company refers to the previously disclosed “Operating EBITDA” metric as “Adjusted Operating EBITDA". This represents a change in name only. The Company defines Adjusted Operating EBITDA as earnings (i.e., “Income (loss) before income taxes”) before interest, depreciation, amortization, non-operating pension and other post-employment benefits / charges, and foreign exchange gains / losses, indirect legacy costs, and adjusted for significant items. Reconciliations of these measures are provided on the following pages.
Long-lived assets are attributed to geographic regions based on asset location.
| Long-lived Assets by Geographic Region | December 31, | |||||||
| In millions | 2025 | 2024 | ||||||
| Americas: | $ | $ | ||||||
| United States | ||||||||
Other Americas 1 | ||||||||
EMEA 2 | ||||||||
| Asia Pacific: | ||||||||
| Taiwan | ||||||||
| South Korea | ||||||||
| China | ||||||||
| Other Asia Pacific | ||||||||
| Total | $ | $ | ||||||
1.Includes Canada and Latin America.
2.Europe, Middle East and Africa.
F-43
| Segment Revenue, Significant Segment Expenses and Segment Adjusted Operating EBITDA | For the years ended December 31, | |||||||||||||||||||
| 2025 | 2024 | 2023 | ||||||||||||||||||
| (In millions) | Semiconductor Technologies | Interconnect Solutions | Semiconductor Technologies | Interconnect Solutions | Semiconductor Technologies | Interconnect Solutions | ||||||||||||||
| Segment net sales | $ | $ | $ | $ | $ | $ | ||||||||||||||
Less 1: | ||||||||||||||||||||
| Cost of sales | $ | $ | $ | $ | $ | $ | ||||||||||||||
| Selling, general and administrative expenses | ||||||||||||||||||||
| Research and development expenses | ||||||||||||||||||||
Amortization of intangibles & other segment items 2 | ||||||||||||||||||||
| Add: | ||||||||||||||||||||
| Equity in earnings (losses) of nonconsolidated affiliates | $ | $ | ( | $ | $ | ( | $ | $ | ( | |||||||||||
Depreciation and amortization 3 | ||||||||||||||||||||
| Segment Adjusted Operating EBITDA | $ | $ | $ | $ | $ | $ | ||||||||||||||
1.The significant expense categories and amounts align with the segment-level information that is regularly provided to the chief operating decision maker.
2.Other segment items include immaterial other gains or losses and miscellaneous income and expenses.
3.Depreciation is a reconciling item to segment Adjusted Operating EBITDA as it is included within Cost of sales, Selling, general and administrative expenses and Research and development expenses.
| Reconciliation of Segment Adjusted Operating EBITDA to Income before income taxes | For the years ended December 31, | |||||||||||||
| (In millions) | 2025 | 2024 | 2023 | |||||||||||
| Semiconductor Technologies Segment Adjusted Operating EBITDA | $ | $ | $ | |||||||||||
| Interconnect Solutions Segment Adjusted Operating EBITDA | ||||||||||||||
| Reportable Segment Adjusted Operating EBITDA | $ | $ | $ | |||||||||||
| + | Corporate Adjusted Operating EBITDA | $ | ( | $ | ( | $ | ( | |||||||
| - | Depreciation and amortization | |||||||||||||
| + | Interest income 1 | |||||||||||||
| - | Interest expense | |||||||||||||
| + | Non-operating pension/OPEB benefit credits (costs) 1 | ( | ||||||||||||
| + | Foreign exchange (losses) gains, net 1 | ( | ( | |||||||||||
| + | Indirect legacy benefits (costs) - net | |||||||||||||
| + | Significant items charge | ( | ( | ( | ||||||||||
| Income before income taxes | $ | $ | $ | |||||||||||
1.The twelve months ended December 31, 2025 excludes accrued interest income earned on employee retention credits. Refer to details of significant items below.
F-44
The following tables summarize the pre-tax impact of significant items that are excluded from Adjusted Operating EBITDA above:
Significant Items for the Year Ended December 31, 2025 | Semiconductor Technologies | Interconnect Solutions | Corporate | Total | ||||||||||
| In millions | ||||||||||||||
Acquisition, integration and separation costs 1 | $ | $ | $ | ( | $ | ( | ||||||||
Restructuring and asset related charges - net 2 | ( | ( | ( | ( | ||||||||||
Employee retention credit 3 | ||||||||||||||
| Total | $ | ( | $ | ( | $ | ( | $ | ( | ||||||
1. Acquisition, integration and separation costs primarily related to financial advisory, accounting, consulting, and other professional advisory fees related to the Separation.
2. Includes restructuring actions and asset related charges. See Note 4 for additional information.
3. Reflects the accrued interest earned on employee retention credits and is recorded in “Interest income” within the “Other income (expense) - net” line item in the Company’s Consolidated Financial Statements.
Significant Items for the Year Ended December 31, 2024 | Semiconductor Technologies | Interconnect Solutions | Corporate | Total | ||||||||||
| In millions | ||||||||||||||
Restructuring and asset related charges - net 1 | $ | ( | $ | ( | $ | $ | ( | |||||||
Legal costs 2 | ( | ( | ||||||||||||
Gain on licensing agreement 3 | ||||||||||||||
| Total | $ | ( | $ | ( | $ | $ | ( | |||||||
1. Includes restructuring actions and asset related charges. See Note 4 for additional information.
2. Reflects legal settlement charges relating to an intellectual property matter.
3. Reflects the license fee income received under an intellectual property license agreement.
Significant Items for the Year Ended December 31, 2023 | Semiconductor Technologies | Interconnect Solutions | Corporate | Total | ||||||||||
| In millions | ||||||||||||||
Restructuring and asset related charges - net 1 | $ | $ | ( | $ | ( | $ | ( | |||||||
Gain on divestiture 2 | ||||||||||||||
| Total | $ | $ | ( | $ | ( | $ | ( | |||||||
1. Includes restructuring actions and asset related charges. See Note 4 for additional information.
2. Reflected in “Other income (expense) - net”.
| Segment and Corporate & Other Information | Semiconductor Technologies | Interconnect Solutions | Corporate | Total | ||||||||||
| In millions | ||||||||||||||
| For the Year Ended December 31, 2025 | ||||||||||||||
| Total assets | $ | $ | $ | $ | ||||||||||
| Investment in nonconsolidated affiliates | ||||||||||||||
| Capital expenditures | ||||||||||||||
| For the Year Ended December 31, 2024 | ||||||||||||||
| Total assets | $ | $ | $ | $ | ||||||||||
| Investment in nonconsolidated affiliates | ||||||||||||||
| Capital expenditures | ||||||||||||||
| For the Year Ended December 31, 2023 | ||||||||||||||
| Total assets | $ | $ | $ | $ | ||||||||||
| Investment in nonconsolidated affiliates | ||||||||||||||
| Capital expenditures | ||||||||||||||
| Capital Expenditure Reconciliation to Statements of Cash Flows | 2025 | 2024 | 2023 | ||||||||
| In millions | |||||||||||
| Segment and Corporate Totals | $ | $ | $ | ||||||||
Other 1 | ( | ||||||||||
| Total cash used for capital expenditures | $ | $ | $ | ||||||||
1.Reflects the incremental cash spent or unpaid on capital expenditures; total capital expenditures are presented on a cash basis.
F-45
NOTE 23 - SUBSEQUENT EVENTS
Share Repurchase Authorization
F-46